AheadoftheNews Blog

A blog on market moving news and futures trades.

Monday, July 31, 2006
That NASDAQ AD line was telling us something and we have gone down to test 10 dma on COMP/QQQQ and NQ.


Gold is having a rough time with 643, 50% 2006. The recent bounce off 600 looks like a bear flag so far. Gold needs to get back above 640 soon to negate the creeping bearishness.


YM (Dow e-mini ftures) faltering slightly today at 50% 2006 (11249). We have come a long way so expect a retest at some point of 11124, 38.2% if we can't get back above 11250 quickly.


Natural gas on a tear. Look for support at 7.80 and resistance at 9.15 (September contract). I would rotate out of oil and into natural gas should 7.80 hold.


Momentum traders might want to keep an eye on the NQ 30 mn chart and 20 ema (green line), support so far. Also note the coiling action in the Bbands, indicating a strong move either way ahead.

There is a good chance we will see lower oil before the elections. This article paints a picture of presidents having little say over prices, but I think this administration is too close to oil to not have way of bringing about temporary changes at a crucial point.

July 31 (Bloomberg) -- Crude oil at $70 a barrel was enough to prompt President George W. Bush in January to pledge to make the U.S. self-reliant for its energy needs. Today, with the cost of a barrel approaching $80, he's mostly keeping silent...
...The president's party may be vulnerable to a voter backlash over high energy prices in November's midterm elections, according to a Bloomberg/Los Angeles Times poll conducted last month. Fifty-eight percent of respondents said they have cut other spending because of rising energy costs, and 61 percent said Bush is responsible for high gasoline prices.
The political perils of the issue were demonstrated by the experiences of another U.S. president, Jimmy Carter, who sought to enact a national energy policy during a period of rising energy costs.
In April 1977, Carter appeared on national television in a cardigan seated by a roaring fire to deliver what he called ``an unpleasant talk'' in which he advocated a program of ``strict conservation'' and ``the use of coal and permanent renewable energy sources, like solar power,'' an effort he described as ``the moral equivalent of war.''

While Carter eventually got a version of his program passed by Congress, energy prices -- driven by events such as the 1979 Iranian revolution -- kept rising. Carter's call for conservation was widely mocked by his opponents, who used to it to paint him as a weak leader, and he was defeated for re- election in 1980.
Norm Ornstein, a fellow at the Washington-based American Enterprise Institute, says that ``the ghost of Carter'' serves as a lesson. ``It's very clear when you try and rally the public behind some grand energy scheme, it's not going to work,'' he says.
``You can look at it two ways,'' David Hamilton, a Washington official of Sierra Club -- an environmental group that's often critical of Bush -- says of the administration's efforts. ``They either didn't mean it in the first place or they really have been ineffective in making anything meaningful happen.''
Link

So far, QQQQ holds exact support at 20 day moving average (36.89) and that sets up 37.37, 23.6%. NQ side would be 1534. On the flip side, today's lows must hold as they represent key support at this point.

Friday, July 28, 2006
NASDAQ, QQQQ, NQ and SMH all close above their respective 20 day moving averages. Bullish.


SMH (Semi-conductor holders) breaks out of the wedge/channel. 31.75 is next resistance if 31.10 holds.


NYSE year lows at 37, year highs at 96. As you can see on these charts, we have had a steady drop in new lows (left chart) since the high in June and a rise in new highs (right chart), supporting the bullish posture at this point.

Keep an eye on COMP 2089 and QQQQ 37, 20 day moving averages. A close above would confirm the bullish breakout possibilities I charted with NQ on Tuesday. A failure of this entire bounce at the close would be very negative. I don't think that will happen this time, but move your stops up just in case.

The ten year drops below 5% and it is starting to get pretty certain that the Feds are done for now. For the past two years, when we got this close to a Fed meeting, we've never had such a reading in the future's market. This means that any rate hike by the Feds would be a huge negative with disastrous consequences and Bernanke knows this. My bet is that Feds will pause in August and actually lower rates in October, right before the elections. Bernanke wants the soft landing and if he gets it, look out above. All the Armageddon theories by bears (and pretty much every media out there) would go out the window.

July 28 (Bloomberg) -- The U.S. economy grew at an annual rate of 2.5 percent last quarter, less than half the pace of the previous three months, as companies and consumers reined in spending.

The first estimate of the quarter's gross domestic product, the value of all goods and services produced in the U.S., compares with a 5.6 percent gain in the first three months of the year, the Commerce Department reported today in Washington.

Bonds rallied and the dollar dropped on speculation the weaker-than-expected expansion will persuade the Federal Reserve to suspend its two-year run of interest-rate increases. Futures traders put the probability of a move when policy makers meet next month at 28 percent, down from about 90 percent last week.
Link

Thursday, July 27, 2006

It could have been worse, a lot worse. QQQQ holds above 10 dma (36.25, exact support today) and the 5 dma at 36.33, keeping for now the bullish cross alive, but barely. Nevertheless, it was a disappointment for bulls. They will take some comfort in ES holding the 50 dma at 1267 but SPX closes below the 200 dma, so we have a mixed picture with a slight bearish bias. Keep an eye on the SOX. Today, it held 400 and that was no small feat given the tremendous pressure bears put on late in the day. As you can see on the QQQQ chart, VAP (Volume At Price, black lines on the left)) shows considerable activity in the past at 37, but it tapers off right after that until 38.50 zone.

REDMOND, Washington (Reuters) - Microsoft Corp. said on Thursday it sees no reason now why its new Windows Vista operating system would be delayed, but stopped short of committing to its previously stated launch target.

The bounce looks tired but NASDAQ ADV/DEC line has improved. Bears so far are not able to get the kind of reversal they have been accustomed to. This is a very significant day for both bulls and bears alike. Watch NQ 1510 resistance and 1504 gap open support.

NASDAQ ADV/DEC line has fallen to +200 and this latest bounce off gap open for NQ at 1504 will need more ammo than that. I would book some profits on longs.

WASHINGTON (Reuters) - Sales of new U.S. homes fell more than expected in June to a seasonally adjusted annual 1.131 million rate and the median home price fell for the second month in a row the government reported on Thursday, as the U.S. housing market showed more signs of cooling.


This is offsetting the durable goods number and giving bonds a bid.

Watch the NQ gap between 1495.50 and 1504. Must hold zone on this rally. So far, it's looking good for bulls, especially techs. Let's see if they can hold this one into the close. TRINNQ is bullish, NASDAQ ADV/DEC line dropping from 1200 to 700, so keep an eye on that. QQV and VXN (NDX and COMP volatility) are confirming the bullishness. Nasdaq new 52 week highs about even with lows.

July 27 (Bloomberg) -- Orders for U.S.-made durable goods rose more than forecast in June, pointing to momentum in manufacturing that's likely to buttress the economy even as the housing market sputters.

The 3.1 percent increase, led by demand for commercial aircraft and computers, followed a revised 0.3 percent gain the month before, the Commerce Department said today in Washington. In a separate report from the Labor Department, initial jobless claims unexpectedly fell to a six-week low.

Orders for computers and electronics rose 3.4 percent last month after falling 2.1 percent. Communications equipment orders increased 8.3 percent after rising 6.6 percent the month before.
Link

Nice rally. QQQQ coming up against key resistance at 37.10. For NQ, that would be 1521.

Wednesday, July 26, 2006
The talking heads keep worrying about inflation, but it is a non-issue at this point. Inflation always keeps a slight uptick at first even as the economy slows, then it eases. The Feds would be well-advised to pause and wait for more data. Rental prices keep going up as mortgages get too expensive and raising rates will only exacerbate that problem. Since rental prices are 40% of the reading, you can see the pickle they have put themselves in. Just by resurrecting housing, they will lower rental prices and ease inflation. Last time I checked, there wasn't much pricing power anywhere else. Just go to the DELL website and see for yourself. Gasoline prices? That is a tax, hardly something that can be passed on to wages. However, the Feds often waver on this as you can see in this 1997 analysis:
Link

Rally sputters at the close, but SPX holds on to 200 dma, ES 50 dma and NQ 10 dma. It feels very precarious and there is a tremednous wall of worry, but bulls should have more upside coming.

Intraday update:
Against all odds, except those who follow charts, NQ lifts itself up right where I mentioned it needed to. Low today is 1483, we are now at 1502, well above the daily pivot. SOX is green and the target is now moved up to 20 dma at 1524 for the week. Of course it could all fall apart, but SPX is now back above the 200 dma and could close there a second day in a row. That would be bullish. Also note the ES bounce today at 50 dma.

Tuesday, July 25, 2006

AMZN throws a stinker after-hours but it is more company specific, not a sales growth issue. We will see how the markets react, but here is an updated chart of NQ, the proxy for QQQQ and NDX on the future's side, As you can see, we are still very much on track for the bullish breakout I wrote about a few days ago, but the key support zone has now moved up to confluence 5 and 10 day moving average at 1483. Needs to hold after all the noise is said and done.

NQ 50% last week is 1484. I would not be surprised to see bulls make a stand there.

The rate fears are back with the high Consumer Confidence numbers. Bulls need to not let this drop get out of control. So far, this looks like a normal consolidation with the SOX still green.

ES breaks out above 1269, 50 dma. Watch that going forward today.

Monday, July 24, 2006
TXN delivers and could give techs some serious follow-through tomorrow. Watch resistance at 29.
Link

NQ closes above 10 day moving average, YM and ES close above 20 day moving averages. This is pretty significant as it is a first for NQ in July. Bullish.

A major victory for bulls would be an NQ/QQQQ close above 10 day exponential moving average, the first in July should it occur. We are not that far away (1493/36.43).

Sunday, July 23, 2006

The QQQQ chart looks like a broadening descending megaphone, but NQ (NDX e-mini futures) gives us a slightly different take. Since I usually trust the futures side more, let's look at that chart. The top line is right-angled and this type of broadening descending pattern (with a right angle)usually breaks out to the upside and is bullish. Conservative traders should wait for the breakout (1613), but keep this pattern in mind for support levels if you are trying to front-run it. Should the double bottom at 1557/1559 break, next support is 1443 or so. However, if we hold Tuseday and Friday lows, we could get the upside break.


The DOW is still trading pretty solidly above 10689, 50% 2004/2006, but again, another index sitting below the 2003 trendline. A break below 10689 sets up 10458 in a hurry, but if bulls manage to get the DOW back above 10920, all is not lost. Obviously, a flight to quality has helped the DOW more than others, but should the Feds pause or halt (which is becoming a very distinct possibility), that trade wil unwind pretty quickly and set up a rally in sectors that have been hurt the most in recent weeks.


Let's pan put to the NYSE weekly chart. As you can see, we have fallen out of the 2003 bull market trendline support and closed below it for two weeks in a row. This is a bearish development, although the week printed a doji, a sign of uncertainty. Nevertheless, keep an eye on the 50 week moving average (brown line), now at 7913. We have had six weeks out of seven bouncing and closing above that moving average, so it is shaping up to be a key test for the overall rebounding capabilities of the stock market. We had pretty much the same pattern in August 2004, but the major difference back then was that it happened above the 2003 trendline. Things are very different now as the market is clearly leaning over the precipice.

Saturday, July 22, 2006
The bottom from Tuesday did in fact hold, but it is a real disappointment for bulls overall. The only support for the markets now is the perception that the Feds are done and in fact might even lighten in October. That's it folks, because earnings were nothing to write home about. We all knew that the Feds went too far, now it has trickled down into earnings and it is obvious their zeal to curb inflation is only matched by their zeal to ruin Americans.
COMP 2015 is a must hold going forward.

Friday, July 21, 2006
COMP holds on to 2003 highs as support (2015) and NQ holds S1, but is struggling with the gap open at 1470. Opex players want to get QQQQ 36 back, but it will be tough.

DELL warns and the party is over.
Link

Thursday, July 20, 2006
Pimco is betting Feds will pause in August (video):
Link


GOOG found support today at 23.6% retrace 2004/2006. That is a key number (385), since it is also current trendline support. 200 dma is at 390.70 and the stock cannot play around to much here or risk diving very quickly to the 360 area. If it holds above 390, watch 404.50 resistance. The stock is back in bull mode above 410. A resolution out of this triangle is imminent.

MSFT delivers and is trading above 24 after-hours. It looks like bulls get some help from Mr. Softie.


The all clear for QQQQ (and NQ.NDX) cannot be given until we get a close above 10 day ema now at 36.73 which is clear resistance at this point (even clearer with NQ). Watch NQ 1485 support followed by 1475. MSFT and GOOG after the close. One thing for sure: the markets do not want to hear about anymore Vista delays.

Wednesday, July 19, 2006

This weekly chart shows the New Yearly Lows for the NASDAQ. As you can see, we have reached levels that mark strong oversold conditions and could set the stage for a lasting rally. It has gotten worse before, so use discipline in your stops. QQQQ is being held back by GOOG and YHOO, but otherwise, NQ is holding on to key support at 1477. The line in the sand today will be NQ 1465.
I like the fact that the NASDAQ bounced hard off 2003 highs of 2015 yesterday and is now up more than 50 points from that low. It is impressive, especially given the bad news from YHOO. This means the market is now telling us that all the bad news is pretty much priced in. Oil keeps dropping and that is an added bonus.

The markets like what Bernanke had to say:
July 19 (Bloomberg) -- Federal Reserve Chairman Ben S. Bernanke said policy must be mindful of the future effects of past interest rate increases while remaining on guard against ``persistently higher inflation.''

``We must take account of the possible future effects of previous policy actions -- that is, of policy effects still `in the pipeline,''' he said in the text of testimony to the Senate Banking Committee in Washington. ``The extent and timing of any additional firming that may be needed to address inflation risks will depend on the evolution of the outlook for both inflation and economic growth.''

The hope is that the Feds stay aware of the fact that inflation can keep creeping up even after the economy slows, but that eventually it will level off, so it is wise to not get too aggresive at this stage of the game.
Link

Tuesday, July 18, 2006
It's going to be about Bernanke tomorrow, but we also have lots of volatility carrying news. YHOO is taking GOOG down with it, but IBM will provide support for same sector stocks in QQQQ/NDX. NQ futures will need to hold 1465. SPX did a strong test of 1225 with a nice reversal, but we are still below 1241, 5 dma. ES 1237.50 is monthly S1 and bulls need to hold it. QQQQ 36 is supportive, thanks to all those puts expiring on Friday.
We will also have oil inventories at 10:30 EST. The sell-off was rather brutal in energy as all that nonsense about the conflict in Lebanon disrupting oil shipments quickly turned out to be just that: nonsense. I wrote about that over the weekend and it came as no suprise. They drove crude down hard on a double test of 79.40 on the September contract and now oil bulls will need a couple of real hurricanes to justify this premium. There is one brewing, see link below.
Link


NASDAQ and the 20 monthly moving average. Today we found support at at the 2003 highs (2015), but the key for bulls going forward will be to get back above 2150 soon.

QQQQ finally hits the 50% projection June High/Low that NQ did last week. 35.74 and must hold.


If the lows hold, we could be building the head of an inverted H&S with NQ (QQQQ/NDX applies as well)on the daily chart. I'm jumping the gun a little (that is what I'm paid to do) but that would put the neckline around 1610, then a drop down to 1530 for the right shoulder, and off we go. This all depends on the lows holding now and a rally out of this to above 1530 by the end of the month.

It is pretty clear that option expiration players are trying to hold up QQQQ 36 and we could very well get up to 38 by week's end, barring a disaster. The markets have pretty much figured out that the war between Israel and Hezbollah will not broaden into a wider conflict and is now focused on earnings and inflation. Speaking of inflation, the drop in gold is telling us that the markets are accepting another rate hike, thus tempering the danger of inflation. Watch 642, key support. The rising rate scenario is not going to help stocks for very long, so one hopes Bernanke looks at the incoming data as not fully reflecting the downward pressure he has applied to the economy. I certainly hope he decides to pause in August, if not to just sit back and analyze more data, which for the most part is lagging.

Monday, July 17, 2006
Oil drops nicely, as I suspected it would once cool heads look at the bigger picture, in fact September contract is double topping at 79.40 and even though we are trading August, it is giving you a clue that we could have seen the highs for now. Key support for August contract is 75/75.50. Keep in mind that we could still see another push, but so far the sector is being sold.
QQQQ should hold above 36 since option expiration games have kicked in. NQ did test the 50% projection June I wrote about last week at 1465 overnight and that should be our low going forward for the time being (QQQQ 35.74, but the cash index never got that low).

Sunday, July 16, 2006
The situation in Lebanon is very grave, but to infer that all out war in the middle-east will emerge from it is a little bit far-fetched if not disingenuous. First all, the standing armies in the region, Egypt, Jordan and Saudi Arabia have clearly no intention of getting involved. Syria's army is old and weakened. Should Iran itself decide to get openly involved as a military force, it will ruin all its chances of ever getting its nuclear program off the ground. The Arab league countries have condemned Hezbollah and it is very doubtful oil shipments will slow down, unless of course Iran stops its production, but that is doubtful as well. The markets are reacting hysterically and eventually they will come to. Bearish sentiment is at a historical extreme and this is no time to bet the house on the end of the world, which just about every financial web site is doing. It's nonsense.

The bull/bear ratio is getting close to where it was in early 2003. Not quite as low as October 2002, but we are getting there, without even being in a recession. That does not mean the markets will rebound from here, but it does mean that the boat has now tilted to the other side.
Link

Friday, July 14, 2006

NQ futures getting close enough to 50% June retrace as did QQQQ. It should hold up, as we have a pc ratio of 5 for the QQQQ 36 strike. I showed you yesterday the QQQQ chart with fib projections from June, here is the NQ chart. 1465.75 was front-run for now at 1468.25, but watch that zone and QQQQ 35.74. One can get ahead of it. If you want to play the long side and hold over, I suggest you use options only and September strikes. This is a good spot to pick up some QQQQ 35 or 36 September calls (QQQQ 35.80) Futures should not be held over the weekend if long, unless you are holding gold or oil.

If QQQQ 36.08 breaks, next support is 35.74 (50% June).

QQQQ hit my next support at 36.08, 38.2% projection June. Those fibs can be pretty accurate. With option expiration next week and all those puts above us, I would not want to be short at this point. The reversal could happen very quickly and there is lots of ground to cover on the upside and limited on the downside.

Overnight session just saw NQ test S1 at 1577 as well as 38.2% projection June at 1580 and a bounce is on after the Israelis pull out of Gaza. The stage is set now for GE to report.
Link

Thursday, July 13, 2006

I have to go back to QQQQ once again, the leading indicator of this market. Note that we dropped the July 2005 lows I wrote about yesterday. Next level, most likely visited tomorrow or pre-open, will be 36.08, 38.2% projection June. Note that 100% projection correlates to the April 2005 low of 34.35. A very scary thought indeed. I don't think we got that far, but 61.8% at 35.40 is a possibility if we can't hold on to 36.08. Nevertheless, let's not get too carried away in the bear game yet. Support is everywhere, the markets feel like they want to rally, witness the move this morning, but it needs good news, anything. Right now, it's all bad, but the good news will come. Let's hope it is soon.

It was just too much bad news. The worry in the oil markets is that the two Israeli soldiers end up in Iran, which would pretty much ensure and Israeli attack on Iranian oil facilities. QQQQ is now at baseline support, and as I mentioned earlier, we should get back above 37 next week, so you will probably get a higher price if you want to get out. Of course, we could have a black Friday scenario tomorrow.
All this makes me think the lows are being put in this month, not in October like everyone was thinking. The markets need Mr. Bernanke to come out and announce an emergency rate cut. I don't think he will, because he is arrogant which makes him incompetent. His little speech a few months ago dismissing the inverted curve and its implications is one example. He thinks he knows better than the bond market where billions are being shuffled around every day. Wrong. Greenspan did it a surprise cut in 1998, maybe he should call Bernanke and remind him of that. It worked, remember that? Saved the markets.

Watch NQ 1505, that is the key for this bounce to hold.

NASDAQ 163 new 52 week lows versus 9 new highs. Another bottom signal. We will see if we get a key reversal day out of this, but so far it is looking very good, big jump off lows. Now bulls need to hold yesterday lows at NQ 1511.

Gasoline futures are down, while crude oil surges. I guess all the speculators hoping for WWW3 in the middle-east are all over the oil action.

We also had another day with equity pc ratio above .80, that is 3 in a row, and I dare you to find that in the data CBOE gives us. Three days in a row. Those who are saying there is not enough bearish sentiment to get a reversal are out of their minds.

Intraday: TRIN NQ hit a high of 3.57 and is now down below 1. Huge bullish divergence on the daily with so far a nice tail below for NQ/QQQQ/NDX. Hitting 36.36. a key number in the late 2003 bull run resistance and bouncing, makes me think we bottomed. The "valuation" calls should be coming. Nevertheless, stops should be raised to 36.40 or so, NQ 1494.
This action is making me rethink my earlier call of a summer rally followed by a big decline into year-end. We might have actually seen the worst for the year. Stay tuned and stay safe.

Intraday: QQQQ found support at 36.36, which is an old friend from resistance back in late 2003 and support in early 2005. I think it will hold as a low. Crude is dropping a hair. Be careful and very disciplined with stops. NQ 1505 is R, above that, bulls get in the gap and some traction.

QQQQ at 36.57 came within 3 cents of the July 2005 low in the pre-open session. Keep that number on your alerts (36.54) for possible support.

If you are in the NQ weekly S2 trade at 1505, consider exiting or moving the stop up pretty quickly. We should close some of this rather large gap.

It's going to be a nasty open. NQ has fallen below weekly S2, ES has dropped 20 dma. Remember that QQQQ July 2005 low is at 36.54. It is a must hold for bulls, or the crash scenario is not out of the question. The Feds have obviously gone too far from the looks of the unemployment numbers and earnings overall. Now the consumer is hit with a very serious rise in oil prices. Bernanke should come out with a pre-emptive rate cut. But he won't, since those folks never admit to being wrong.

Wednesday, July 12, 2006

QQQQ lower low with, again, a bullish divergence. Who'se counting.

Two back to back readings of equity pc ratio above 80. Haven't seen that since 2004.
Link


Semis taking another hit today, but SMH finds support at 50% projection May (30.85). Possible hit of 30.27, 61.8% but we are nearing an end to this absurd hysteria. Valuations are just too good to ignore at this point.

Gold broke out above 640 resistance zone and is now a buy above. Buy dips, but stops should be no lower than 630. Any 10 mn candle below 631 negates the bullish bias. 665 is minimum upside target if 640 holds.


Ugly day, but QQQQ is approaching a very heavy support zone, the July 2005 low at 36.54. In fact, NQ weekly S2 is at 1505, so one overnight push lower, or at the open, would set up a pre-option expiration week base of support. 171K puts were purchased today at 37 strike for a total put open interest of 467K at that single strike. That gives you an idea how far the bearish sentiment has gone. No guarantees in this business, but 37 holding up next week is pretty much a given.
Link

Gasoline futures shooting up on the numbers.

EIA inventories coming up at 10:30. Last week, the higher gasoline numbers put a damper on the oil rally, but now there is expectation that was only a pre 4th of July stocking up. Pay particular attention to those numbers, they will tell us how much Americans drove over the holiday. If inventories of unleaded gas are way down, oil will breakout above 75. The opposite will pretty much end the present rally.

Tuesday, July 11, 2006
I recommend you watch this video, courtesy of Bloomberg:
Link

This reversal occured with an equity pc ratio of .81, which is historically within the extreme bearish sentiment zone. Not to be confused with index pc ratios, which go much higher. We have to go back to mid-October 2005 to get a higher reading (.89).
Link


QQQQ/NDX a little messy these days with all the volatility surrounding semis and the diverging opinions, so let's look at the COMP to see if a pattern is emerging, other than the obvious selling we have been witnessing. It's not as clean as the SPX inverted head and shoulder (see July 5 post Link) but it is present if today's lows hold. The slanted neckline would put us right around a test of 50 dma at 2185, should the trendline support off June lows hold like it did today. Stay tuned, but a break above 2185 sets up a projection up to 2300. That seems like a stretch, but even a 50% projection would have us visit 2250 area. Not bad. Of course, 2185 will be key as will be current trendline support at 2115.


A quick look at the GOOG chart. A bearish divergence on the last rise gave us a two day decline, but the stock snapped out of it today, like many other techs. The question going forward will be trendline resistance not far above at 430, which is also 23.6% projection June. The good news is that it is part of a symmetrical triangle whch is normally a continuation pattern. A break above 430 sets up 100% projection June at 467 and a close of the January gap. Not a bad ride if it happens. Watch the action at 430.

NEW YORK (Reuters) - U.S. stocks rose on Tuesday in an afternoon rally triggered by a surge in shares of KLA-Tencor Corp. after the semiconductor equipment company said orders were rising more than it expected

This a day after Merril Lynch downgrades the sector, sending us tumbling down yesterday. They would never tell you to get out at a top or buy at a bottom, no sir, that would make you some money.

Bulls held it into the close, the SOX was the canary in the mine, bullish all day. Looks like a key reversal, once again. Stops should be moved up to QQQQ 37.23 conditional on all long positions. Leave yourself a little room, but 37.33 should hold.

Intraday update: possible reversal shaping up. TRINNQ has moved down to .75, QQV is at low end of range. The SOX has been green most of the day, giving credence to that bullish divergence on new low for QQQQ/NDX/NQ. Watch NQ (NDX e-mini futures) to hold above weekly s1 at 1527.25 now. All stops on longs should be moved up to there. ES support is 1267.25. QQQQ at October lows again (37.33) and that is a must hold for any bounce to hold into the close.

Monday, July 10, 2006
I agree with him 100%. The time has come:
SAN FRANCISCO (MarketWatch)
Oakmark fund manager Bill Nygren expects fallen growth stocks to rise...
...Similarly, Intel stock peaked in 2000 at $76 a share on a $5 a share sales base. Even adjusting for the cash back then, it was about 15 times sales. Intel's product is more propriety than Dell's, so they deserve to sell at a higher price to sales, but 15 times is a number we find kind of ridiculous. Today you're paying about a market multiple on earnings, and not much more than the market multiple on sales, for a very strong balance sheet and a company that's repurchasing shares.
It's easy to forecast that semiconductor sales are going to grow more rapidly than the economy. It's also easy to project that five years from now Intel will be the leader in semiconductor sales. If it turns out that Intel is just an average company, then the price we're paying is appropriate. For it to be a bad investment, you'd have to argue that it's a worse than average company. The chance that five years from now we're talking about Intel as a superior company is a much higher probability.
Link

Over a million put contracts for QQQQ july strikes between 36 and 39 and only 465K calls. That's a pc ratio over 2. Where are the bears going to find any more ammo, other than naked put sellers covering their positions? Will this be a repeat of the May opex disaster, where hedge funds had to cover en masse those usually easy money puts sold? I hope not. In any case, there is no call resistance until 39 and tons of puts below and above at 38.
Link


Volume was lighter than normal, nevertheless QQQQ went down and tested June lows, but with a bullish divergence. Furthermore, it closed back above October lows (37.33). That will be the number to watch going forward.
As for oil, it closed a second day below the key 74.20 level (see my post on Sunday). Unleaded gas took a beating, let's hope they pass that along to the pump soon. Inventories on Wednesday will be closely watched to see if last week was just a July 4th holiday stocking surplus number.
On the radar: NVDA which hit 50% 2004/2006 and is a tentave accumulate going forward if it holds that level (18.32). Vista will require heavy graphics and RAM, all of which will eventually benefit stocks like NVDA, ATYT and MU. Just keep in mind that the markets are in a "glass is half-empty" mentality and one should exercise patience and show restraint.

Unleaded gas drops 3.18%, but techs are taking a beating on a Merril Lynch, late to the party, downgrade of the sector. QQQQ needs to hold October lows at 37.33.

Intraday update: QQQQ tests October lows.

Sunday, July 09, 2006

Pay close attention to the trendline support off June lows for QQQQ (NDX) (see chart). It sits at around 37.45 and the same support was successfully tested with a bounce by NQ (NDX e-mini futures) on Friday (see Friday post). This is reassuring for bulls, but should that trendline fail, it brings about the very real possibility that the rally we have seen was a large, but nevertheless clear bear flag. Watch NQ futures overnight. The 1542 level must hold. My guess is it will and the bear flag will be invalidated, but use caution until we clear out of this pattern. We went from an equity pc ratio of .46 on 6/29 to .71 on 7/5, quite a shift as bears started piling on again and as I suggested in my last post, it could work in the bull's favor. They just need some good news and fast.


Pretty much all the negative data coming out regarding the consumer and retail sales is tied to the cost of gas. Is there some light at the end of the tunnel? On a purely contrarian basis: yes. Find me a media outlet that is not calling $80 oil and above a "given" short term, and I will gladly post it here. And when everyone gets very certain about something, I turn a little bit contrarian. Don't get me wrong, $80 oil might become a self-fulfilling prophecy short-term, but just like Dow "new all time highs" was a "given" only a few month ago, I get a little uneasy with herd-like agreement. Fundamental reasons? Yes and no. Yes on a short term basis, no on a long term basis. Yes short term because a few factors are entering the equation which could alter what the market seems to be pricing in at this time. Increase in Iraqi oil production, lighter than expected hurricane season and a cooling off of geo-political tensions. Any two of those factors will give us a quick $5 drop in crude prices. I don't want to make a fool out of myself with a prediction on weather, but again, the contrarian in me is seeing the bad news getting priced in and absolutely zero good news being considered. Keep an eye on the weather patterns, a good link is provided at the end of this article. No on the longer term picture, and that is for obvious reasons. Unless we fall into a recession ( I don't buy that quite yet), demand for oil will invariably outstrip supply and prices will keep rising, although a slower economy will act as a temporary ceiling. But $80 is bound to happen. Eventually.
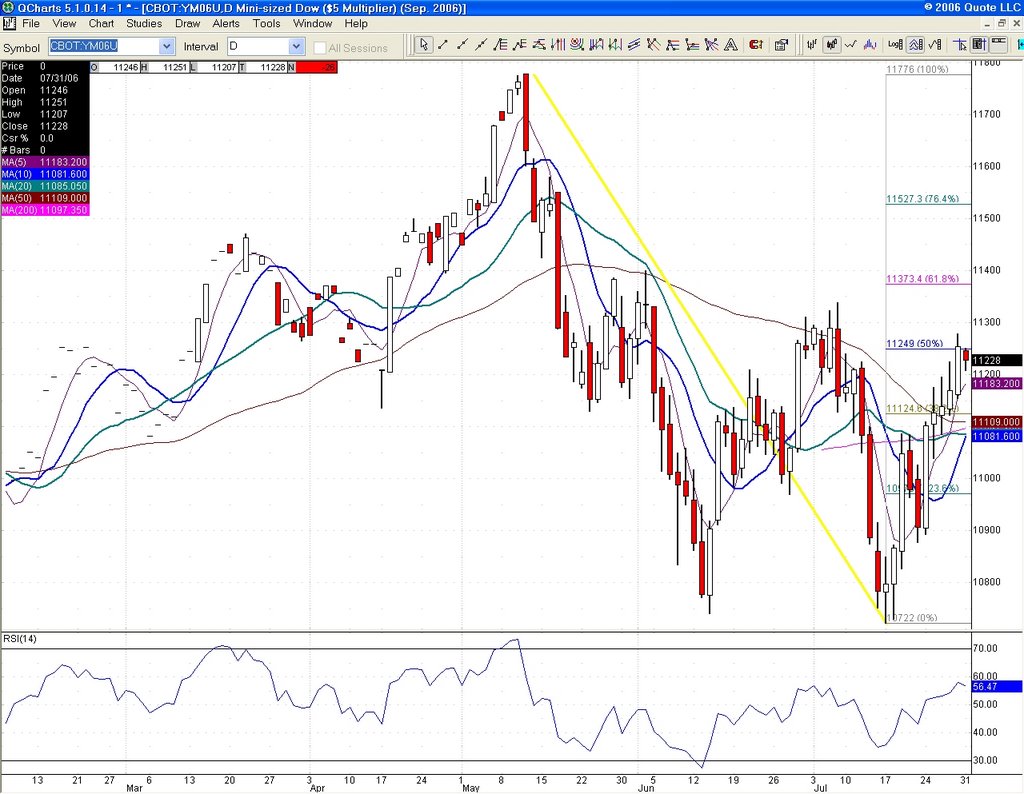
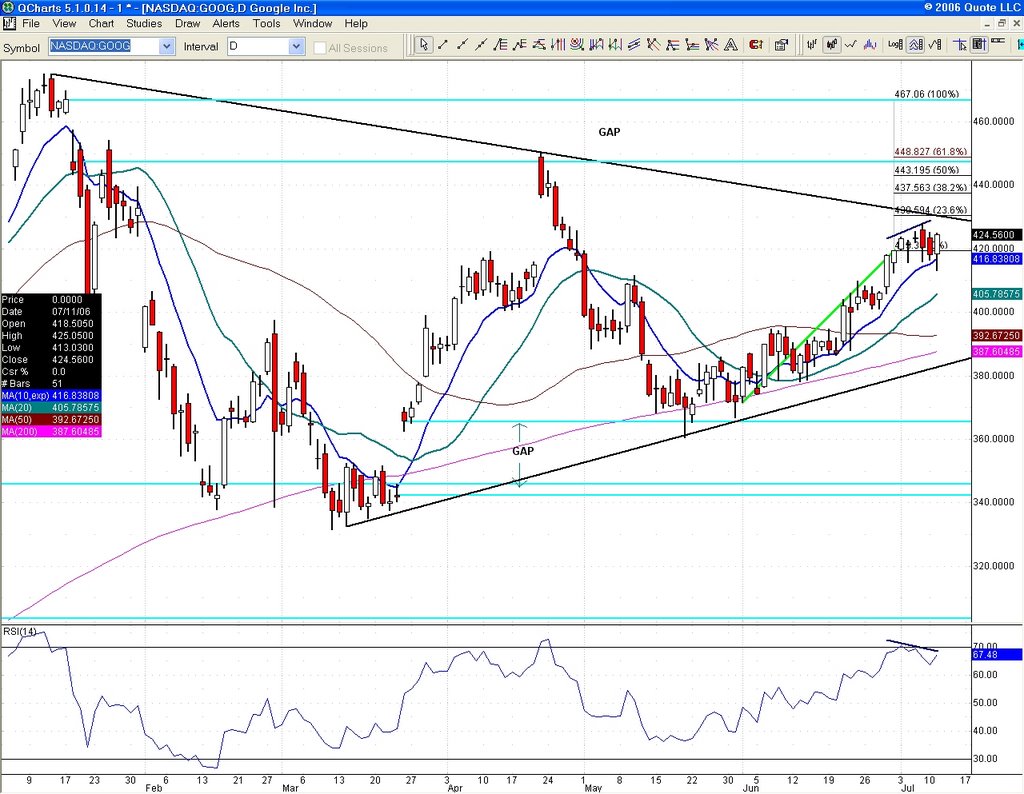
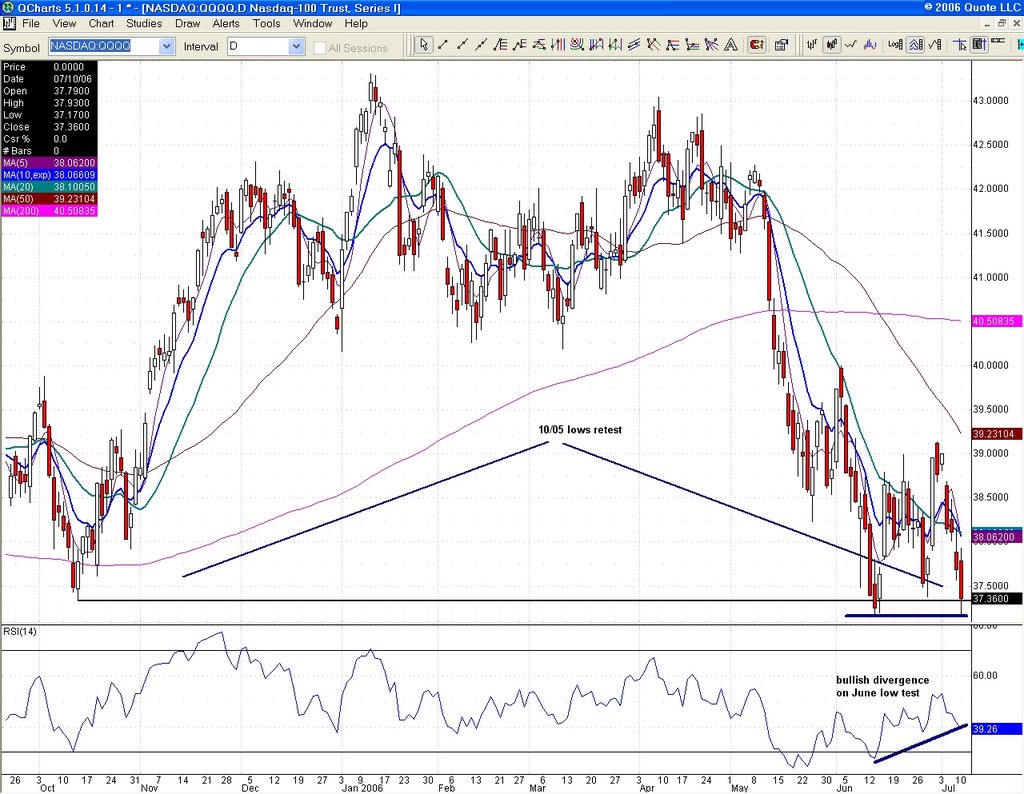
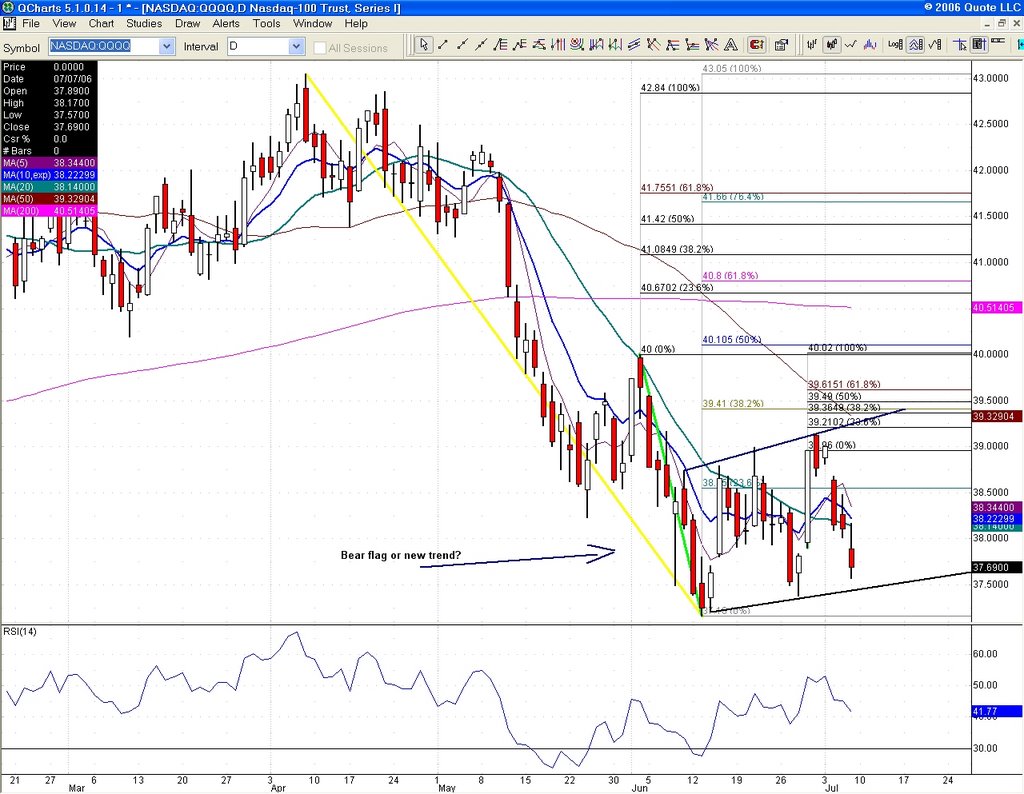
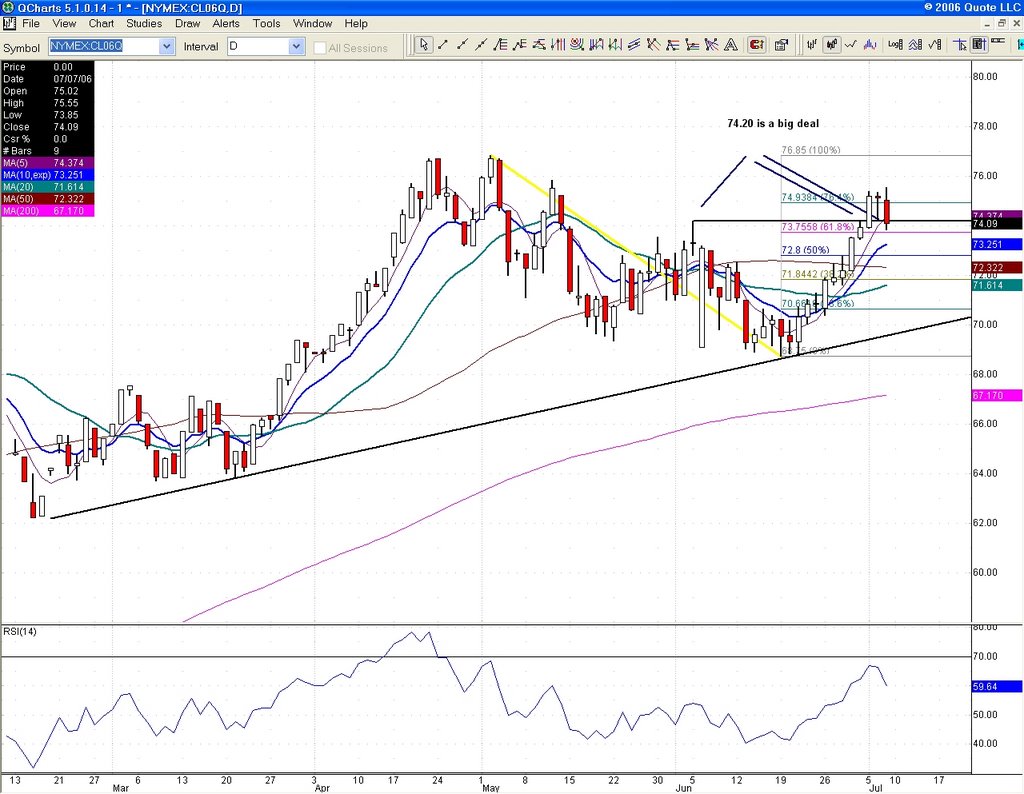
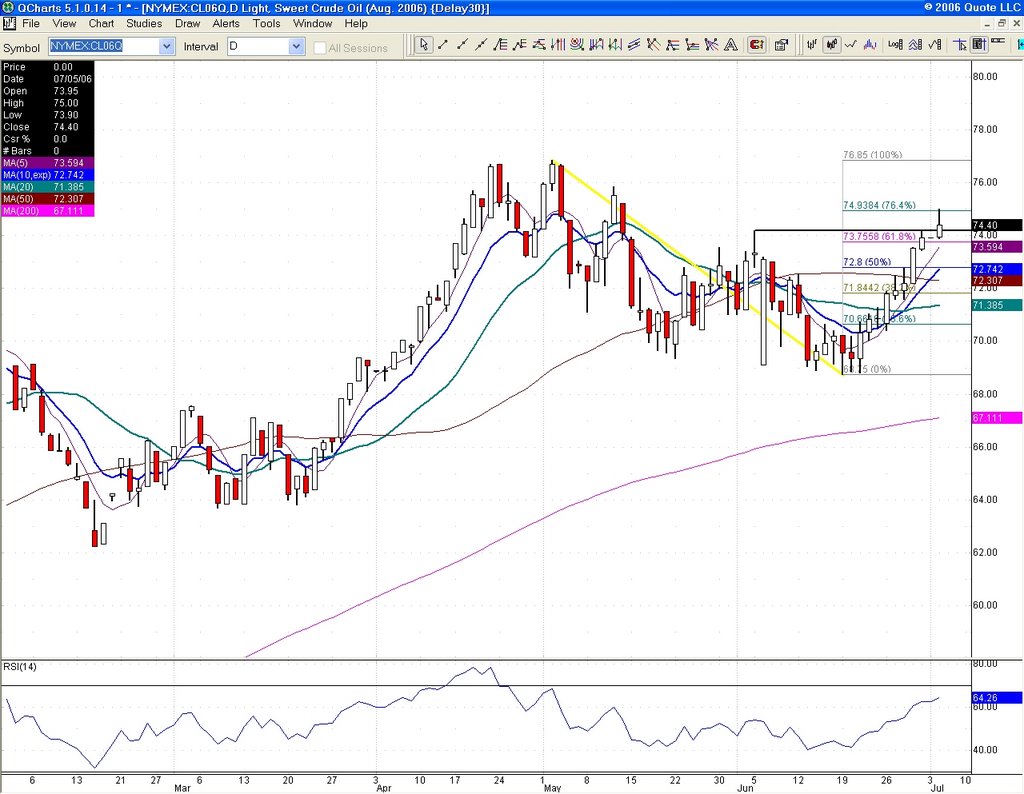
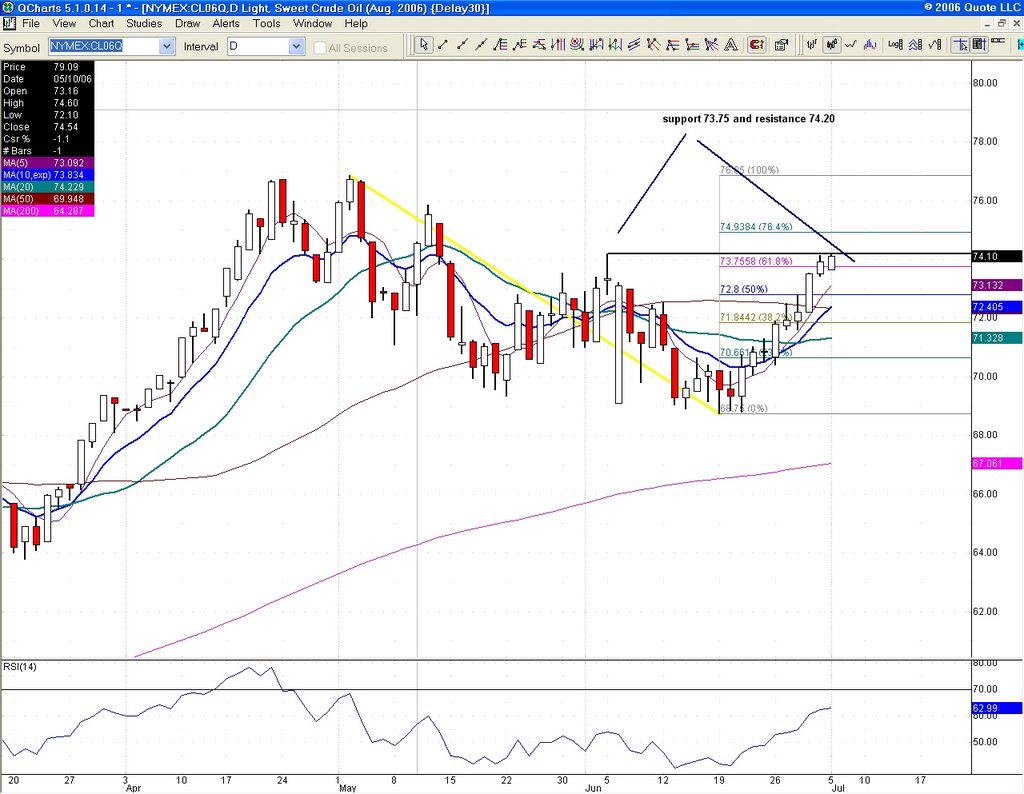
As for the chart, 74.20 failure on Friday was an eyebrow raiser. Watch that level. If oil bulls fail to close another day above that, we will see a drop to the mid 72 area. This could spell relief for stocks, especially tech stocks if they can avoid another big name warning. That is not a given, but again, I think it is getting priced in as well. In fact, many companies are poised to beat already reduced projections and if that happens, the short-squeeze we saw in late June and early July will be repeated, if not surpassed in intensity.
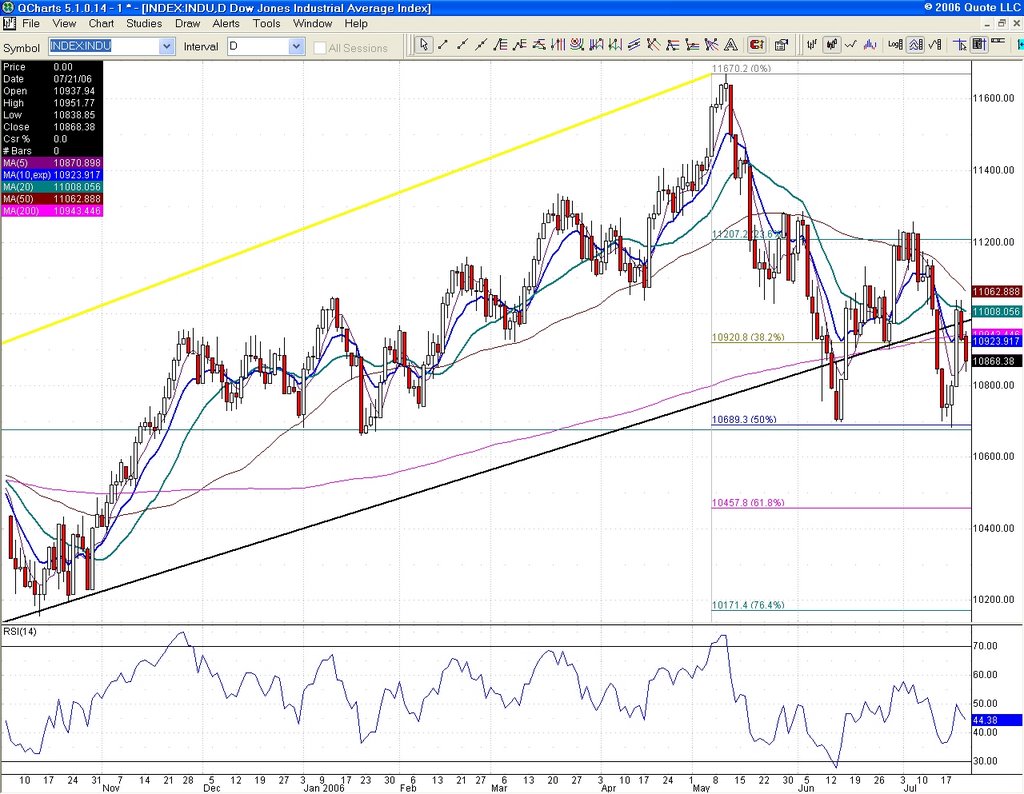
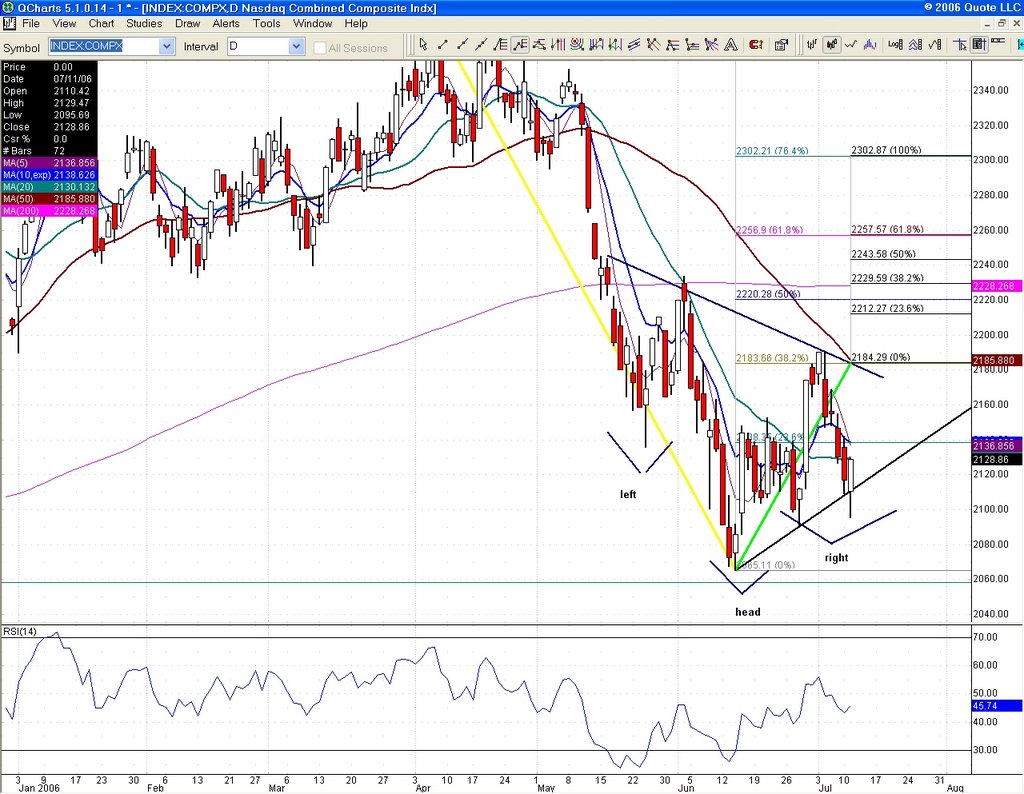
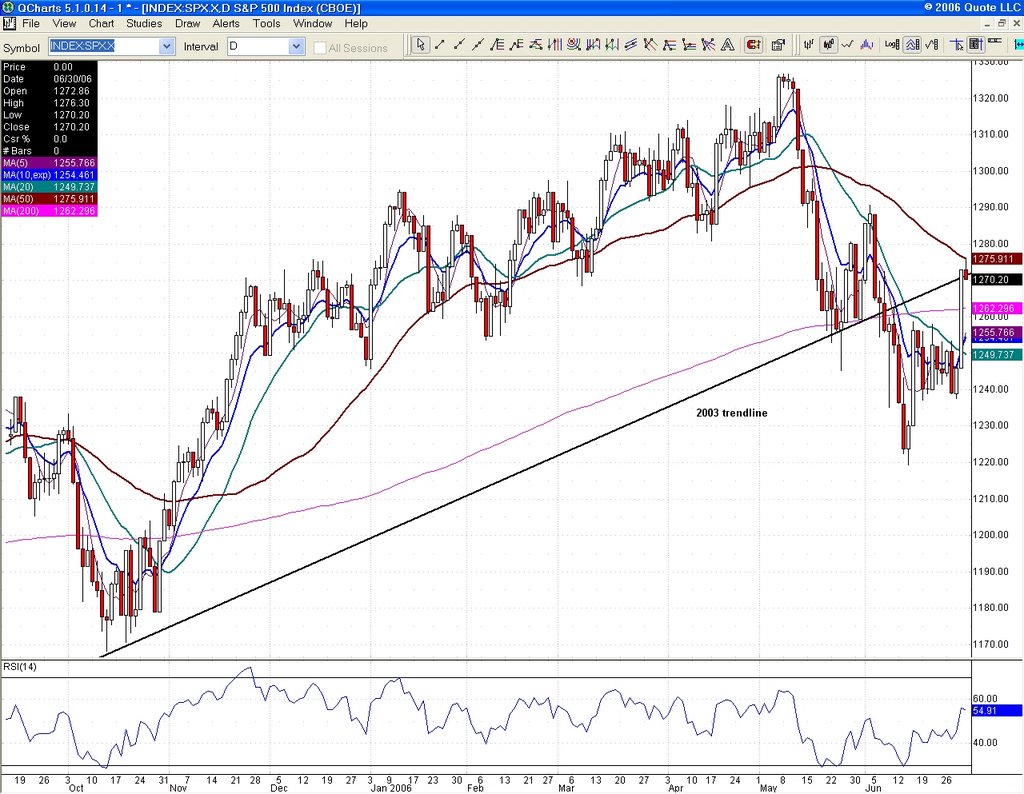
Of course, everything the oil bulls and equity bears are predicting and placing huge bets on could come to pass and we will fall over the edge of the cliff. Maybe. But I tend to think that will happen when everyone least expects it, just like after the big summer rally of 1987. That is when I will turn very bearish indeed. Nevertheless, watch the charts and support levels, they are the final arbiter.
Link

Saturday, July 08, 2006
July 7 (Bloomberg) -- Bill Gross, chief investment officer at Pacific Investment Management Co. and manager of the world's biggest bond fund, said the bear market in bonds is over.
``The bond bear market is beginning to go into hibernation, which is the same thing as saying the bear market's over,'' said Gross in a television interview from the firm's headquarters in Newport Beach, California. ``It ended two days ago on Wednesday. While we're not about to reap huge capital gains, bonds will do better from here in terms of price.''
``As we near the end of a Fed cycle, the economy starts to slow down and that is indicated not only by this payroll number, but the last two before that,'' he said. ``I think the Fed is about done at 5.25.''
Link

Friday, July 07, 2006
I will remember this week as the one Wall street failed to send a clear message to the Koreans that we will not be intimidated. Instead, the Boyz decided to use the public fear to make a buck. The other thing that bothers me is that I bet this Korean thug shorted the markets for millions ahead of his silly missile launch and has profited handsomely. I really thought the Street would whack him with a nice short squeeze, but it seems they have forgotten which country they belong to. I am saying this because I think the markets will not fall part quite yet and that they are gunning for further gains this summer. That they stayed with the program this week instead of giving the Bronx cheer to that idiot in Korea makes me quite furious, especially when you know how easy it is for them to do so.


NQ went down to test the trendline off June lows (see chart) and we bounced from there in the closing minutes. ES/SPX found clear support at 10 day ema. This whole exercize of so-called fear (who seriously believes the Koreans are a threat) was meant to pick up stocks at cheaper prices. Yields have dropped and so has oil. There should be rally on Monday or Tuesday out of this mess.

July 7 (Bloomberg) -- U.S. Treasuries rose for a second day after a government report showed the economy created fewer jobs last month than analysts forecast, damping speculation the Federal Reserve will lift interest rates next month.
Link


The NASDAQ does a clean bounce off 23.6% 2006 and is now back at 10 day ema. This where we see if bears are going to attack again.

The drop in yields did in fact start a reversal at lows for ER and NQ should catch up. Lower yields always gets small caps going. Mr Bernanke should pay attention to the signals the bond market, and gold for that matter, is giving him. This is why I did not want to rush into the gold frenzy until we saw a move above 640 on volume (see post July 4th).

Techs have found some support at weekly S1 for NQ. NYSE advance/decline is now positive. Yields keep dropping and that is protecting the markets so far.


Trendline support off June lows is at NQ 1541/1542 and QQQQ 37.46/37.50, absolute line in the sand for bulls. Yields are dropping so there is a real possibility a reversal could occur at any time.

Look at NQ to test 1548.50, weekly S1. ES is being helped by energy stocks, but it could test 1271 at some point.

An initial bump on the lower jobs numbers is now being replaced by selling as the market decides to focus on the wage inflation aspect of the report and of course, record oil prices.
Link

Thursday, July 06, 2006
COMP holds 10 day ema once again. 2150 is definitely a marker, as is QQQQ 38. There is a minor gap at NQ 1558 from June 28, so if long, stops should be just below that. Monday's gap close at 1602.50 (QQQQ 39) is a target on a breakout. 30 mn B-bands are coiling and setting us up for a big move soon either way.

Oil rallies off support and forces NQ down to 20 dma. Must hold (1570, although we could overlap and test 61.8% and overnight lows at 1565.

Gasoline futures now down almost 2%.

That last interest rate hike was almost one too many by the Feds. It is just insanity to keep punishing consumers any further.
July 6 (Bloomberg) -- Retailers reported slower sales gains for June as a jump in gasoline prices curbed spending and flooding discouraged shoppers on the U.S. East Coast.
Link

Oil and Gasoline futures drop slightly on the EIA numbers. Let's see if it sticks. Oil has key support at 74.20/74.25. Watch 74.95 resistance. Now trading at 74.70.


Gasoline futures(HU)showing a persistent bearish divergence on the daily chart. Some relief in sight for consumers? Let's hope so.

NASDAQ new year highs 43 versus new year lows 23. For NYSE, the ratio is even more bullish, 41 versus 17. VIX and VXN down, but TRIN and TRINNQ neutral and giving bulls a pause. Markets are holding their breath ahead of oil inventories in 15 mns.

Watch NQ 1570.50 overnight (20 dma).

Wednesday, July 05, 2006

SPX inverted head and shoulder formimg here if we don't collapse in the next few days. The neckline would be around 1280, a break above sets up projections starting at 1311 all the way to 1340, 100%. Sounds wild now, but it's there. The key will be for bulls to hold 1250/1260 level and break above 1280.

Volume was pretty light today and I'm not sure we can attribute too much significance to today's move. The missile launch was already known weeks ahead of time and it is very easy to move markets when everyone is still on vacation. That said, it will be important for NQ/QQQQ/NDX to regain their respective 20 dma's soon. Weekly pivot for NQ sits at 1579.75 and could be resistance going forward. ES has not given up its weekly pivot yet (1270).

July 5 (Bloomberg) -- U.S. 10-year Treasuries fell the most in three weeks after a private report estimated U.S. companies in June added the most jobs since at least 2001, fueling speculation the Federal Reserve will raise interest rates next month.
Futures traders added to bets the Fed will lift the overnight lending rate between banks after Automatic Data Processing Inc. said companies added 368,000 jobs. The report comes two days before the government's employment report, among the releases most closely watched by bond investors as a gauge of the economy's strength...
... The 10-year yield reached 5.25 percent on June 28, a four- year high, which ``might be the top of the range,'' said Daniel Fuss, a vice chairman and portfolio manager at Boston-based Loomis Sayles & Co., which manages about $70 billion. ``We're in the peaking period of interest rates.''
Declines in Treasuries may also be limited because previous ADP reports have estimated more private employment gains than the Labor Department subsequently documented. ADP estimated 122,000 new private-sector jobs for May, while the government counted 67,000. For February, ADP estimated 342,000 new jobs, and the government tally was 168,000.
``The history of this number being a good leading indicator is shaky at best,'' Andy Brenner, head of global fixed income at Hapoalim Securities in New York, wrote in an e-mail to clients.
Link

A late day rally stumbled and pulled NQ/QQQQ below the 20 dma. COMP held on to its 10 day ema, but it's not a pretty picture with higher rates and a serious bid in oil. Bulls are hoping tomorrow's EIA numbers will take some wind out of the oil rally. Going forward, keep an eye on TNX 52.40 level.

Critical test for bulls now as we approach the 2 PM turn. QQQQ at 38.23. Oil is creating massive headwind for what might have been a real reversal for equities.

It's obvious North Korea wanted to make a statement by firing those lame missiles on July 4th. Now it's time for the US markets to make a statement as well: we will not be scared by such antics. In fact I believe there is such an attempt but it is getting tough as oil moves above 75. I bet some North Korean officials went short the market on Monday ahead of this. I hope the boyz come in and teach them a lesson, but that might be too much to ask for.


Oil on a screaming bid, but watch 74.95, 76.4%. A break above 75 sets up a test of all time highs and possibly 80 in the near future.


If short, you should be mindful of the VXN resistance here at 10 day ema. COMP found clear support at previously mentioned level (2147). Add NQ 61.8% of the late June rally (1565, see 60 mn chart) and bulls could put up a fight here. ES is clinging on to 5 dma and it is a little suprising it has not dropped to test 1270. But the day is still young.

It is rare to find reversals off a -35 day for NQ, but COMP is still holding on to 2147 and since the selling has taken place early on, we have to be mindful of the real action at the close.

When will the Feds realize how crippling higher oil will become? It just amazes me that they still talk of inflation, as if that is going to be a problem if they torpedo what is left of any bullish consumer sentiment. I hope they have looked at past history and seen the damage they have done, almost always overshooting with their reliance on lagging indicators. Why put the economy at risk now? To play tough for academia? There is little if any downside in pausing now and a heck of lot more danger in staying the course. Mr Bernanke, speak out now and calm the markets! That is your job.

COMP finds support at 10 day ema (2147). The selling is exacerbated in NQ/QQQQ/NDX thanks to semis and especially MRVL, a stock Cramer and others have been pushing to the masses.

The only positive divergence I can spot out there is new year highs for NYSE at 45 versus new year lows at 39. Nasdaq is an exact flip, new lows at 45 and new highs at 38.

For NQ, a break of 1570 sets up a test of 1565, 61.8%. ES looks headed for confluence weekly pivot and 10 day ema at 1270. It is doing a little better than NQ thanks to energy stocks, but it could eventually follow suit.


TNX (ten year note) once again knocking on 61.8% projection 2005 H/L at 52.43. A break above will set up a push to 53.90. That could inflict further damage to the stock market, so watch the double top forming here on the monthly chart.

A 3 to 1 put base is building at QQQQ 38 July strike. The 39 strike is seeing increasing put activity, but still a positive pc ratio. Max pain is shaping  up to be at 38.


Triple top near early June highs for CL/QM (oil). Support is well-defined at 73.75, 61.8%, but we have had almost ten days of straight buying, which increases the chances of a pullback at some point. For now though, stronger economic news helps oil bulls who are gunning for a test of 75 soon.

NQ holds on to the 20 dma and QQQQ to the May lows following the positive news on factory orders. But the bid in oil is hurting any chances of seeing a strong reversal at this point. VXN and QQV back up for a test of respective 10 day ema's. If it holds as resistance, stocks could have at least found a base. For daytraders, this still remains a day to short rallies. Watch NQ 1579/1580 for heavy resistance at this point.

July 5 (Bloomberg) -- Factory orders in the U.S. rose more than forecast in May, led by demand for business equipment that may keep the economy from slowing too much.
Orders placed with factories increased 0.7 percent during the month after a 2 percent decline in April, the Commerce Department said today in Washington. Excluding aircraft and other transportation equipment, bookings rose 1.2 percent.
Link

Must hold area here for bulls, NQ 20 dma ( 1571.25) and QQQQ May lows (38.23).

The open did indeed see some panic selling after all. Gold did not hold the bid but stocks are taking a hit. NQ is trading slightly below its weekly pivot (1579.75). Rates have risen sharply and along with a heavily negative advance/decline line it will be tough sailing for bulls today. Watch QQQQ 38.23 (May low).

Things are calming down as the initial knee-jerk reaction loses steam.

Tuesday, July 04, 2006

Since gold is back in the news with the geo-political scare (lots of noise for nothing but again we have to deal with it) let's take a quick look at the chart. Immediate key resistance is at 50 dma (641) and 50% (643). A solid break above gets us into June fib projections with 50% at 703. Since we still don't have a clear picture on the interest rate front, I would wait for a break above 640 to initiate any new gold longs. Always keep the macro picture in mind when we get these events.

We are getting some weakness overnight on the North Korea missile firing as well as a gold bid. It's all overly dramatized by the press, but we have to deal with it as traders. Watch previously mentioned support at NQ 1580 should futures really fall apart. So far, we haven't even closed the Monday gaps. Pretty tame reaction, but the open could see some retail panic.
Link

ES and NQ should close their Monday gaps overnight (1282.25 and 1593.25). Targets are still weekly R1's and maybe R2, although we could swing down to the 1580 area at some point for NQ, which is confluence 10 day ema and weekly pivot.
Market moving news will be starting pre-open with ICSC-UBS Store Sales, important now for bulls after the Wallmart disappointment. Factory orders come in at 10:00ET. Oil inventories (EIA) has been pushed back to Thursday.

Monday, July 03, 2006
On June 13th, I posted an NDX chart showing a possible head and shoulder completion at 1513 and thus a medium turn bottom. Link This turned out to be accurate so far. Since the neckline was around 1637, there is a real chance we will go back up there and test it. That would be around QQQQ 40/40.20. For NQ, that would correlate nicely with 1650/1655 which is also July monthly R1. I know I have put in a target at 50 dma, but keep this possibility in mind if bulls overlap.

I learned long ago not to short these holiday days and today is no different.


COMP is stretching its legs as late June produced a bullish cross of 10 day ema and 20 dma. Target there should be 50 dma at 2205, but if it comes with 20 dma this far away, I would par down positions. 50% is 2220 and with 200 dma not far above that, the whole zone between 2200 and 2220 could be a brick wall. As mentioned earlier, SPX is trading above 50 dma (1275), in large part due to energy stocks.

ISM dropped more than forecast and the prices paid less than forecast. Link Markets are hanging on to the perception Feds will take this slowing into account, but some of it is mitigating by a lesser drop in prices paid than thought. NQ is barely clinging on to the pivot. SPX is right above its 50 dma, but ES is not there yet. The SOX is holding on to 10 day ema. Oil is back above 61.8% (73.75), even with the economic slowdown news, and that is support going forward and a drag on a further NQ push.  Looks like a test of 74.95 likely soon, but it could find sellers. Weekly R1 for NQ is 1623 and that would put QQQQ right at or near 50 dma, my exit target on any longs at this point (39.50). Usually, on these holiday shortened days, bulls carry it. It remains to be seen if it will be into the close.

Sunday, July 02, 2006
July 3 (Bloomberg) -- Some of the biggest investors in the U.S. Treasury market say the worst is over after government bonds suffered their largest first-half loss in seven years.
Northern Trust Global Investments' Colin Robertson forecasts a second-half rally. Paul McCulley of Pacific Investment Management Co. says the Federal Reserve is done raising interest rates. TCW Group Inc.'s Barr Segal expects U.S. economic growth to slow...
...``Barring any surprises going forward the Fed is finished for this tightening cycle,'' said McCulley, managing director at Newport Beach, California-based Pacific Investment Management, which manages more than $590 billion in assets including the world's biggest bond fund. ``The market place got it pretty much correctly.''...
...Pacific Investment Management, known as Pimco, is betting on bigger gains among two-year notes than 10-year securities, said Steve Rodosky, head of U.S. Treasury, agency and derivatives trading at the firm.

``After a pause, the next stage is for them to take back some of the tightening,'' Pimco's Rodosky said.
Link

Saturday, July 01, 2006


Two key charts going forward: SPX and NDX. The first, as you can see closed slightly below the old 2003 bull trendline it had lost in the past weeks as well as a hit and sell off of 50 dma. The second, paused right below the 20 month moving average in an impressive late month comeback, but prints a doji, a perfect reflection of the uncertain times the markets are facing. Time will tell, but watch these two significant crossroads.