AheadoftheNews Blog

A blog on market moving news and futures trades.

Thursday, February 23, 2006
I have received several e-mails on my take for opex in March. I am glad to see that some of you are starting to pay attention to option open interest. It is a vital tool, but for now, it is not quite in play yet, in fact it is almost non-contrarian. But as we head closer to option expiration week, third Friday of each month, it becomes very relevant and contrarian for the most part. In other words, more puts than calls provide support and more calls than puts provide resistance, as option sellers manipulate the markets in order to have as many options expire worthless as possible. Welcome to the big leagues.
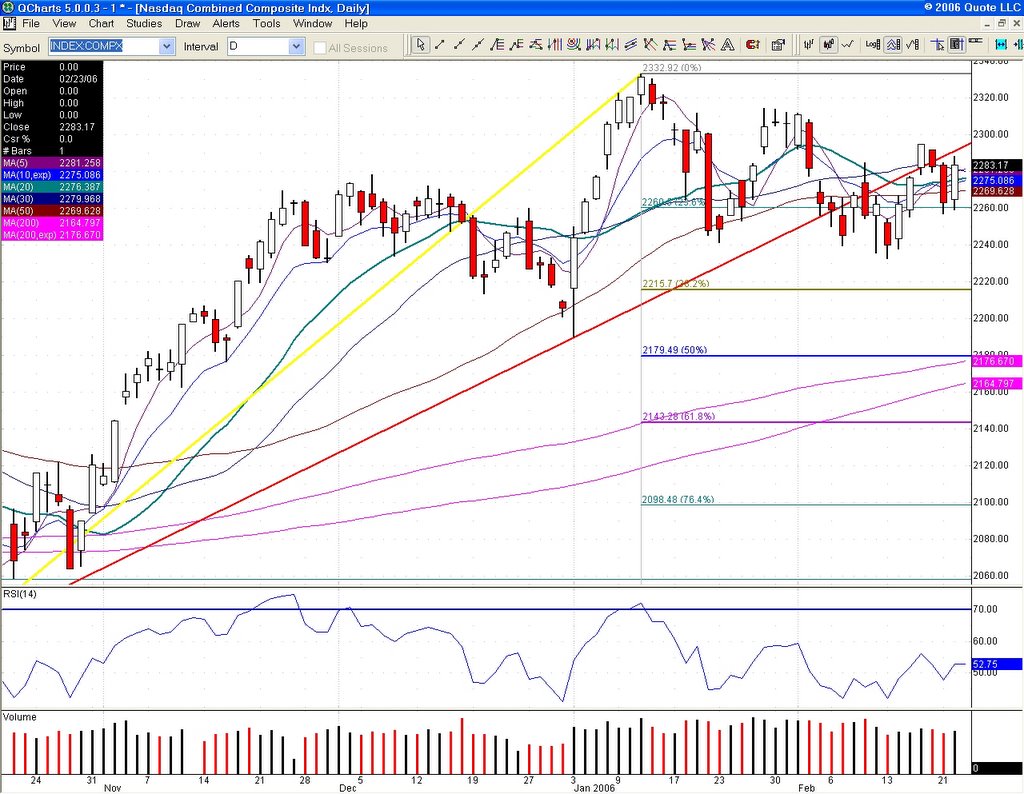
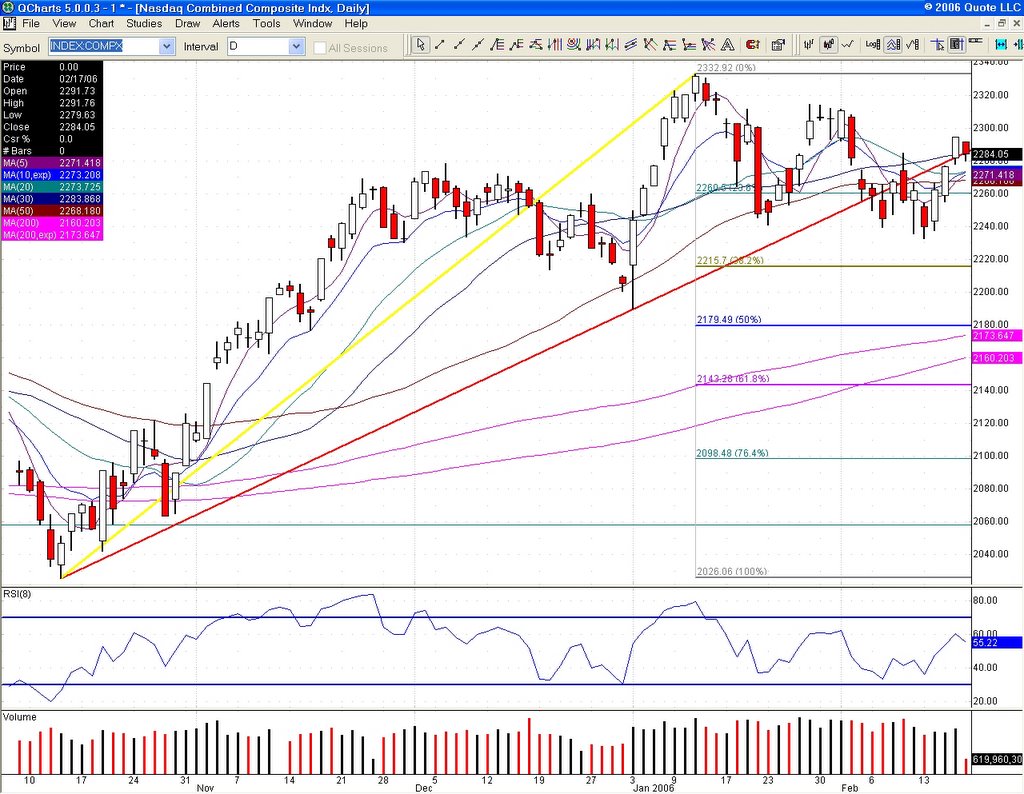
Looking at QQQQ March contract, the 42 strike has a .75 ratio, 180K puts to 245K calls. This can change of course, but usually the trend is set early on. This means QQQQ could face resistance at that level in mid-March. The 41 strike has a 1.05 pc ratio, 279K puts to 265K calls, so more puts there and some support. Note that the total open interest is the highest at 41, sometimes referred to as "Max Pain". They will try their best to close that week in March as near to 41 as they can. Looking further below, we see that the 40 strike has a 5.35 pc ratio, hugely supportive for the markets. You must understand that all this is for the most part hedging, but the calls are very often speculative and tells you a lot about the market mood. The take so far is that we have resistance at 42, 43 and strong support at 40. It will be a range to play with as we enter the month of March.
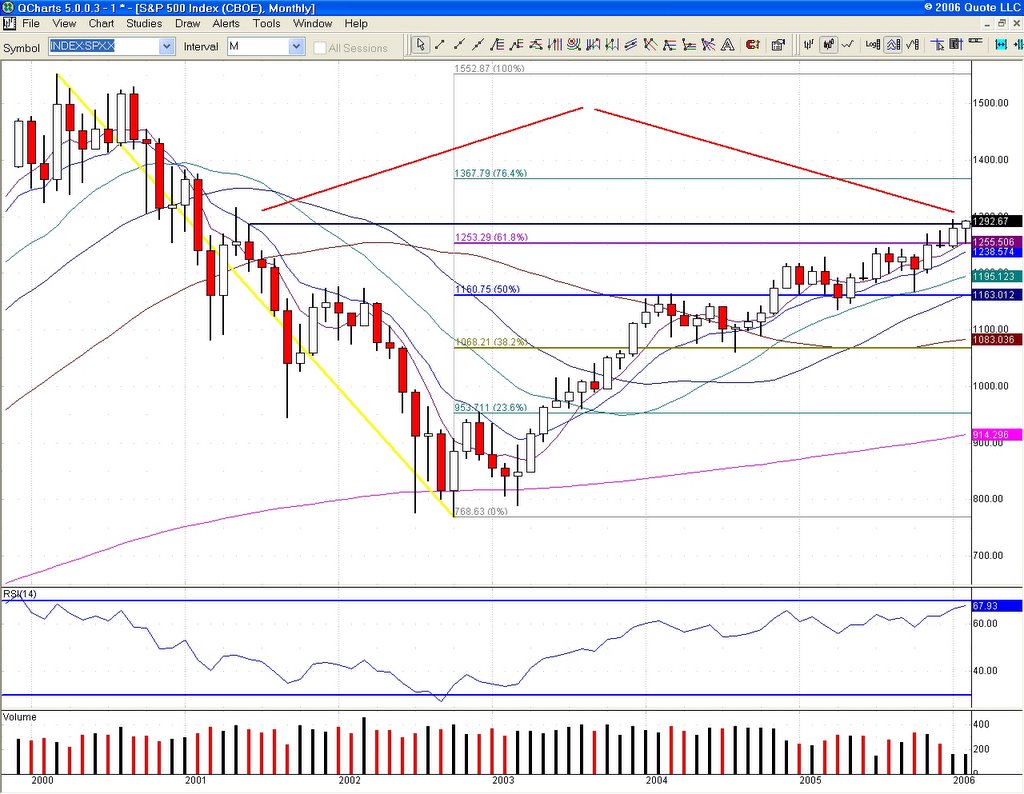
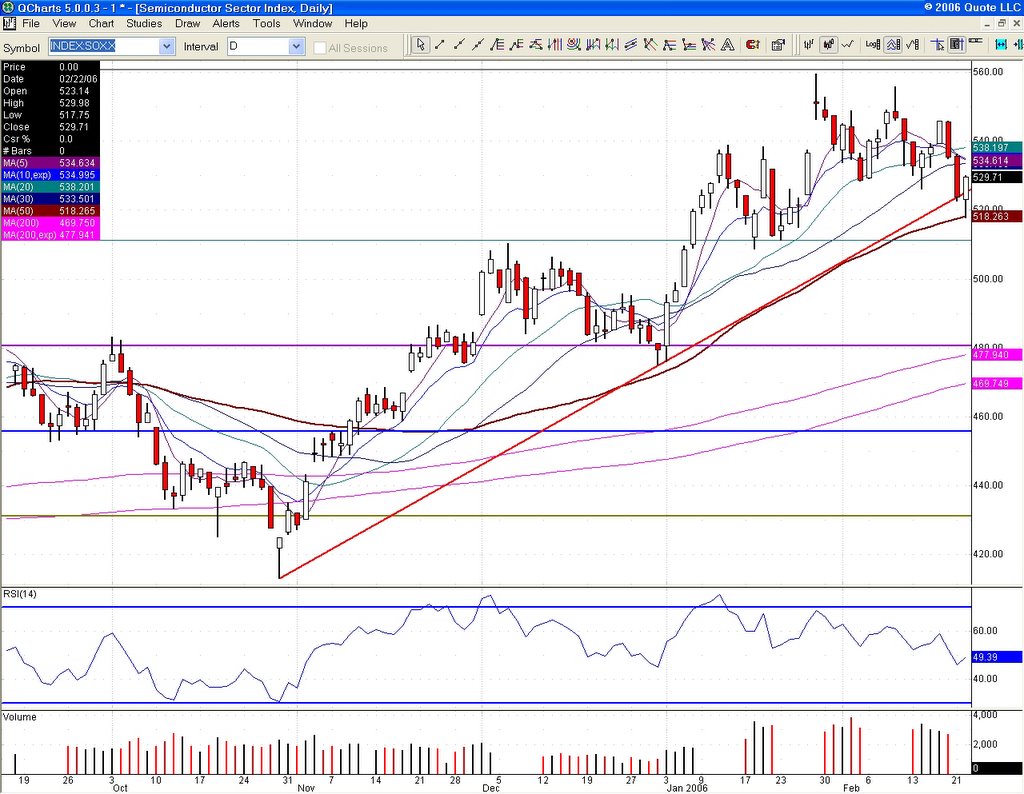
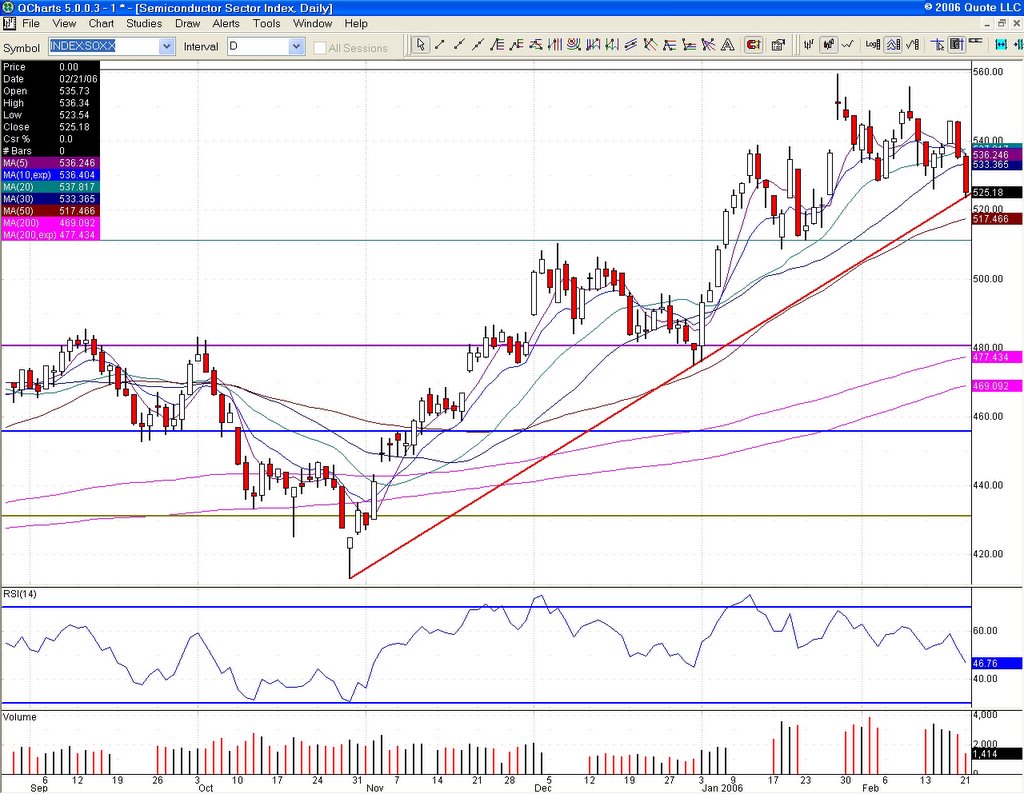
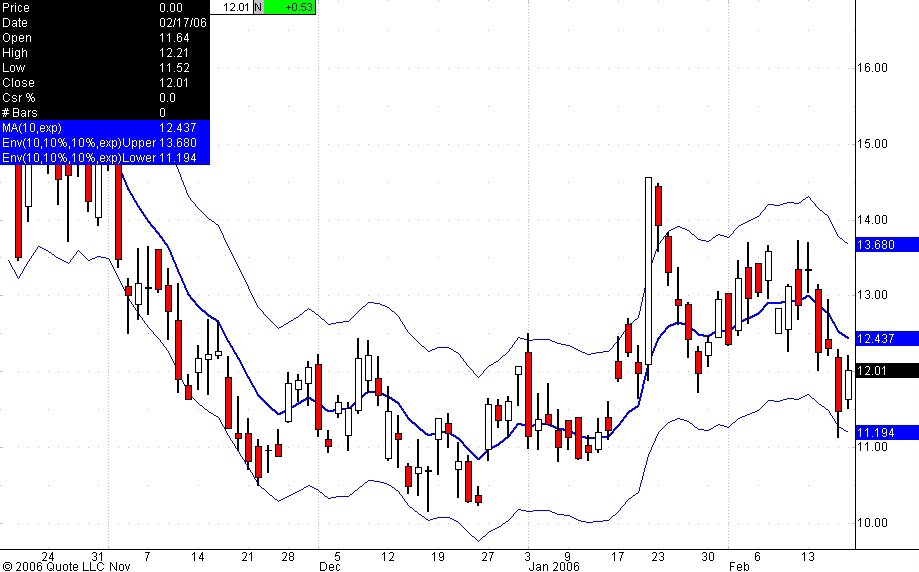
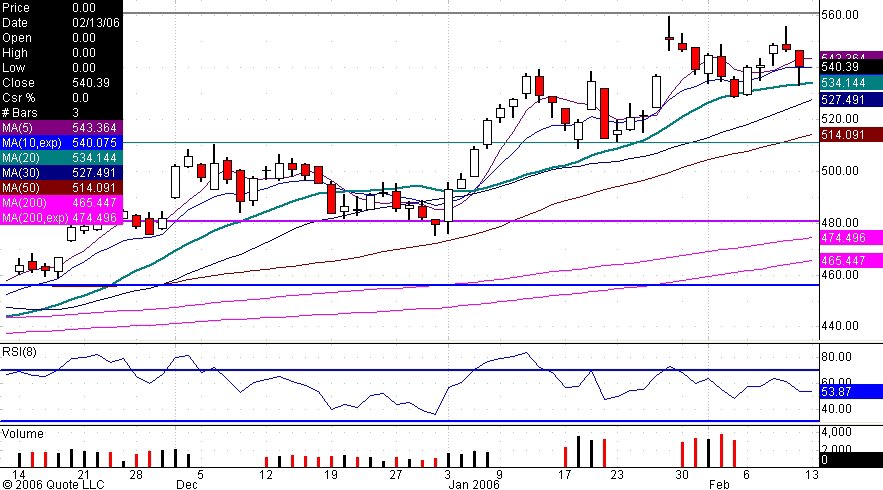
I will not post until next weekend as I am taking a long needed vacation. Pay particular attention to SPX 1286 support nearby (June 2001 high) and below that, SOX 511, an absolute line in the sand for techs. As I commented last weekend, I think oil is headed for the low 50's, but watch 63/64, should it rally.
Be safe and remember to take profits, keep tight stops and never let your bias get in the way.
Link

Intraday Market Update

Once again, a VIX divergence said buy the dips, but watch that SOX, still in the red today.

Wednesday, February 22, 2006

Last but not least, SPX closed above its June 2001 high of 1286 for the first time since that brief encounter on 2/16. It holds that, next stop is 1315. Longer term chartist want to see a monthly close above 1286, which would be a first and very bullish.


Today, the DOW came withing 38 points of the June 2001 high of 11196.53. Big number, folks and pretty close to YM (DOW futures) weekly R1 of 11222, my target for the week. Any move above will get some more wallets to open up, so watch that one. It could also be a kiss goodbye. Critical support for YM is 11050/11070.


Let's not forget the financials, as the BIX (Banking Index) approaches 2004 highs. Support is 369.40, resistance 382.62. The DOW has been on a roll as this sector shines.


COMP closes above 20 dma and now needs to reconquer the old trendline support from October now turned resistance at 2292 (red line).


It's fashionable these days to pounce on Intel with downgrades, but the chart now says buy. Bullish divergence on the daily RSI with a huge gap above that is bound to get some play one day. We have a series of bear flags, but a trade above 21.50 negates them. Conservative traders wait for a break above that. Risk reward now favors upside on this stock, target 23.75.

Intraday Market Update


Brief drop at the open as the SOX went down and tested 50 dma, but it was all bullish after that as oil dropped and techs jumped right back. SOX is now above trendline again and bulls have the reins for now. There was a VIX divergence at the open, falling as markets dropped, and that was your clue to take a long on the dip. That said, keep an eye on oil for any sign of a rebound and don't be afraid to take profits. Watch NQ 1684, 20 dma resistance.

Video Market Wrap

Tuesday, February 21, 2006
Consolidation or correction? The key lies in the SOX, oil and the Feds.
Watch video

Intraday Market Update


COMP has key support at 2261. Bulls have not lost the reins yet, but the SOX fall is troubling. As long as it holds trendline support (just hit) at 523/525 from October, there is hope. A break below is bearish.

Bulls have taken the reins at the open, but watch the SOX, which is not participating so far. Mondays can create nice reversal set ups for the rest of the week. YM R is 11155, gap close is 11125.

Monday, February 20, 2006
The INTC downgrade (a late arrival in the Intel bashing game) pushed the SOX to a close below 20 dma (537) on Friday. NQ has a nasty gap above (1696/1690.50) with key support at 1673. WMT earnings will set the tone early on.

Saturday, February 18, 2006

Oil jumping on Nigerian concerns, but looking at the CL/QM March contract chart, you have to wonder how many times we can bounce off 57.50 before heading lower. Head and shoulder forming on the daily, with a possible right shoulder building. This could mean a bounce to 63 or so, but if that area fails, it would confirm the H&S pattern and set up a break of the neckline at 57.50. Target would then be 51 or so. Watch Canadian and Japanese currencies. The Canadian dollar benefits from higher oil and the Japanese Yen suffers from it. We will see what happens once the dust settles in Nigeria.

Friday, February 17, 2006

Option players did their job and got QQQQ to close below 41.50. Next week, we will get back to more fundamental concerns or hopes. Chart of the VIX shows how we jumped from the envelopes I use. Yesterday was definitely stretching it.

Intraday Market Update


NQ drops 1692.50 and weekly R1 at 1689. ES drops weekly R2. The DELL guidance did not make anyone very happy, but also remember that option sellers want to pin QQQQ below 41.50, so that doesn't help. NASDAQ Advance decline line is the worst off and that is not usually a very good sign. Oil resumes a bid above 59, so the deck is stacked against bulls this morning. Watch COMP carefully, especially right here at old trednline support from October low, turned resistance last week and now support again (2282, see chart). It's also right at 30 dma. Could be supportive.
For you Google watchers, the stock bounced off the 200 dma this week and is now above 361, 61.8% support. GOOG must hold that level, or we risk going back into that gap from last year and closing it at 303. So a key day for GOOG going forward. Resistance is 383, then 395. If long, move your stops up to 359.

Thursday, February 16, 2006
All the targets were hit and some. Note that NQ moved back below 1692.50, a key level, after hours. We will see what tomorrow gives, but I expect QQQQ to be pinned around 41.50, maybe even lower. As for YM, the star of the day, it closed above weekly R2, quite a feat. Opex Fridays are typically not a good day to trade and I recommend staying flat and keeping those well earned profits from a rally that was quite predictable. Those excessive SPX puts I kept harping about were the canary in the mine. Once again, it paid off handsomely to keep an eye on open interest.

Wednesday, February 15, 2006
Nice intraday reversal, clearly set up by the bullish divergence from Nasdaq Advanc decline line.
Watch video

Fed fears will once again return to the forefront today, but overall, the action will revolve around where they want to pin prices for option expiration. In other words, trade it, don't hold it.

Tuesday, February 14, 2006

Lots to say about today, big turn around for small caps, SOX bounced back, DOW 11K and oil below 60. Bulls delivered and my feeling that SPX would be bullish this week to whack all those puts sold in December turned out to be correct. NQ faces resistance at 10 day ema (1672), ES at 30 dma (1279) and YM is getting close to making new highs for the year. The weakest link on a relative basis is NQ, so we will keep an eye on the SOX, as usual. Watch ES 1278.75, weekly R1 as well and right now, NQ 1665/1666 support, old gap close and weekly pivot. The setups were numerous during the day and there were plenty of opportunities to get in long and hop on the train. Opex Wednesdays can be a little bearish at times, so play it tight.

Good day for bulls. Took +11 ES on the monitor and playing momentum now with NQ, trying to catch a short covering rally there as well. SOX is still red, a nagging concern, but ER (small caps futures) has done a remarkable reversal. As usual, don't get married, and book profits as they come along.

Monday, February 13, 2006
Option expiration week shenanigans or something more ominous?
Watch video

Sunday, February 12, 2006

Holding it together is the SOX, finding support for the 3rd time this month at 20 dma. It's a must hold and as long as it does, bulls will keep fighting.

QM (oil) gap at 61.90 is closed. If we start trading above, I might try the long side for a swing trade. However, if 62 holds as R. we could move down to 60.675. next support. That big storm could help prices stabilize.

Saturday, February 11, 2006
Yield curve inversion started some early selling, but stocks came back some at the close. Bernanke is basically being told by the markets to come in and tell the other Feds to simmer down. I certainly hope he gets the message next week or we could see some trouble. Lots of shorts out there, negative press, large put open interest above makes me think we have some support and short squeeze potential, but as usual, we will trade what they give us. More charts over the weekend.

Thursday, February 09, 2006
NQ hit weekly pivot and fell apart in a steady wave of selling. ES briefly went above weekly pivot, but succumbed as well. YM is the only one left solidly above weekly pivot. It was not pretty, but the SOX is still bullish. The NQ long from 1652.50 was exited at 1687.50 and a few short-lived re-entries later, it was best to either step aside or stay short. More key data awaits the markets tomorrow and all of this could once again be reversed. It's definitely a trader's market. Option expiration week is coming and that could provide an upward bias as we are sitting below a pretty solid amount of put open interest. ES 1255 is a must hold at this point.
Watch video

Nice overnight bid. YM (Dow futures) holds ground above weekly pivot at 10859, now support. NQ (NDX futures) not there yet (1687), but working on it. Same story with ES, trading below weekly pivot, but getting close (1273.50). Watch YM resistance at 10886. If YM starts trading above 10886, next R is 10929.

Wednesday, February 08, 2006
YM cracks 20 dma, ES and NQ still stuck but SOX keeps us cautiously bullish. Trail stops and trade this day by day.
Watch video

Futures recovered as techs remain on solid ground. YM and ES went and tested yesterday's lows overnight but seemed to have caught a bid. The long side is still best with NQ or QQQQ at this point. Upside target for NQ is 1687, must hold support is 1652.

Tuesday, February 07, 2006
Some of the bullishness is dissipating as oil stocks take a hit in Asia. NQ (NDX futures) holding up better, no oil there and if you went long at today's lows, you should be ok. The weakness could send YM (DOW futures) to my seconadry low target of 10732, so I would not hold that one long overnight. This market is on edge, take nothing for granted.

Great day of trading. YM, ES and NQ charts:
Watch video

Took a short in the monitor at YM 10832, looking for an inside day. But the short turned into something more as yesterday's lows were violated. If we get back above S1 (10789), then exit the short and flip long.

CSCO fears creeping in. That stock still has way too many otpimists, just looking at the option open interest. As I said last night, keep an eye on the SOX. Bullish bias is negated if SOX falls below 20 DMA at 530. For now, it's a trader's market.

Monday, February 06, 2006
Slight bullish bias held today at the close after a little scare. SOX holding the markets up for now which means any weakness there spells trouble, but for now, ride with it.
Watch video

Good forecast from a health insurance company and some positive anticipation ahead of the new Fed speech is giving futures a lift. Watch YM 10859, weekly pivot. Oil is hovering around its weekly pivot at 66.10, but below 20 dma and seems to be dropping. Support there is 65.80. If the oil bounce falls apart, don't short this market today. The charts outlined below are bearish, but this will be a trader's day, and I'm not sure a bearish position will hold for long. YM has a gap to close now at 10799 and that zone could bring in some buyers. Critical support is 10792. There is that big gap all the way down at 10747, which will get filled one day. For ES, critical support is 1262. Don't forget the SOX and the 20 dma, now at 530. Bullish above, bearish below.

Sunday, February 05, 2006
Small caveat: keep an eye on a possible compromise with Russia enrriching uranium for Iran.

Iran and Chavez conspiring to give us an overnight bid in oil. Could help energy stocks, but not a welcome development for the broader market at this stage.
Watch video

A look at YM daytrades and set up for Monday.
Watch video

Saturday, February 04, 2006
The markets are facing Fed exhaustion. The economy is slowing and yet they keep telling us we might need more rate hikes. Can these academics get out of their ivory tower and just look around, hey, go shopping, ever try that? Pricing power? Where? Have you seen any price hikes anywhere? Can a business even afford to raise prices without losing customers? Enough is enough. These bow-tied tunnel-visioned tinkerers are going to throw us once more into a recession. No more rate hikes. Get it guys?
Our only hope is that their wording was meant for the new chief and that they did not want to put his back against the wall by saying hikes are over after this one. Let's hope. And let's hope Bernanke is a little more hip to what is going on in the real word and actually studies earnings reports, or just goes to the Dell web site and notices computers are still just as cheap as last year and you can get a free memory upgrade, a free DVD burner and a dual core for under a grand. And free shipping, even though oil is out the roof.
There, I said my piece, now we need to study the charts and see what the street does from here. My next post.

Friday, February 03, 2006
Rally attempt failed, but note the Advance Decline line from NYSE closed at -658, off a low of -1614, while YM closed at lows. Some stocks are being bought in the middle of this. YM has a gap to close at 10747 and it is getting closer.

Buying has pushed YM above 10857, weekly pivot. Keep an eye on NQ 1684, 50% of gap and possible resistance. Still plenty of danger ahead especially if NQ falls below 1678 again. YM 10873 and 10885 are resistance above 10857, Support is now 10845, 50% of today.

Second day that NYSE ADDEC line hits -1500. Reversal coming?

Thursday, February 02, 2006
Bullback?
Watch video

NQ closed below 1695, 61.8% January and YM ended at 50 day ema. Only the SOX stayed above 10 day ema. That might be important in the days ahead. RLX (Retail index) in the green along with bonds. More on all this later.

Wednesday, February 01, 2006
Oil dropped, GOOG closed above 400, the SOX rallied and shorts got snookered. NQ (NDX futures) is still facing resistance at 1725, so bulls are not in complete control. But it was quite a feat after the Feds and GOOG drop to come out screaming like this. YM (DOW futures) is the standout, regaining solid footing above October trendline support. 11042 is next resistance, but the real test is NQ 1725. Bulls need a close above.

If bonds go green and GOOG gets above 395/405, I would not be short this market. Just a heads up if you are in bearish positions. Post-Fed rallies have been known to occur at key reversal points. However, keep an eye on oil. I would short 68 there ahead of inventories, but use tight stops. As I noted in the previous post (video), shorts will be attacking GOOG at 395 and try to take it down. Watch that number intraday. GOOG keeps dropping, so will NQ.