AheadoftheNews Blog

A blog on market moving news and futures trades.

Sunday, April 30, 2006

Very straightforward scenartio with SPX, We are trading between June 2001 high of 1286.62 and May 2001 high of 1315.93. The pattern has been slightly broadening since early March with rising 50 day moving average support and a two day close above 10 day ema. Edge still belongs to the bulls.


Increased put activity at the May 42 strike for QQQQ might surpise those who expect the markets to fall apart soon. Granted the 43 strike has some serious call resistance, but we could very well be stuck in that tired range between 41 and 43. Right now, look at 41.74, 50% 2006 support and the 50 dma just below at 41.62 for levels to hold for bulls. Resistance is pretty clear around 42.10/42.15. Trade the range, i.e buy support/sell resistance, and be ready to catch the break either way.
The Monday morning set up is pretty basic with NQ (NDX e-mini-futures) confluence of daily and weekly pivot at 1715.75/1716, the fulcrum for the day.
Link

Thursday, April 27, 2006

Let's take a look at Google (GOOG), a stock that has been lagging lately. Three sizeable gaps, a veritable Swiss cheese, sit unfilled directly below (there are more below 300, but we will stick to these). 303.20, 341.89 and 415. Today's close put GOOG below the 10 day ema and out of the ascending channel started in March, so I expect the 415 gap to be closed very soon, if not tomorrow. After that, the stock better hold the 20 day moving average at 411, or we are headed sub 400 in no time. It would be worth a long trade between 411 and 415, but keep tight stops at 407 or so. Eventually, all three of these gaps should get closed, but that will probably have to wait for what appears to be a second half market correction brewing.


NQ closes below 20 day moving average after a raucous rally, but after the bell MSFT kills it, pushing the NDX futures below the all important 1722.75 (50% 2006) mark. INTC closed above its 50 day moving average for the first time since January and we will have to see if that can hold as support tomorrow (19.82). The problem with this rally is the NASDAQ advance/decline line hovered around the zero line a good part of the day, with only a mild push up to +426 and a close at -310 (chart). Not very inspiring, but volume was there in enough big caps to push the bears to the sidelines. Smells like short-covering to me, but we will see how tomorrow plays out. The bullish mitigating factor is lower oil, somewhat lower rates and some new found energy in semis.

Huge turnaround so far for techs and buying NQ daily S1 at 1697.75 put you in the driver's seat. The Feds came to the rescue as Bernanke comments brought rates down. NQ is solidly bullish again above 1722.50, watch that level intraday.

Wednesday, April 26, 2006


Inside day for ES and NQ. NQ held on to 50 dma, which is somewhat bullish, but the bounce was not very convincing. ES stuck in a rut between 1321.50 and 1292.50 with an absolute must hold at 1304.75, 50 dma. Positive close above 23.6% retrace 2006 and 10 day ema at 1310. We bounced today off the 20 dma at 1308, but it was dicey for a minute. Bears are trying hard to press on but cannot seem to push bulls over the edge of the cliff quite yet. When it happens, it will be brutal, but for now I am tentatively siding with the bulls and favor buying pullbacks at support. Use Bollinger Bands with NQ 30 mn chart, they have been very effective (blue chart).

The Fed Beige Book at 2PM (EST) will be market moving, all else is noise until then. If you are trading NQ, we are in an inside day and trade it accordingly. 32.8% is 1712.25, 50% is 1714.50 and 61.8% is 1717. Support so far was found at 76.4% 1709.50.

Tuesday, April 25, 2006

NQ holding above trendline support from March once again. It has also coincided with the 50 dma. How many times can we hit this level and bounce? My guess is none. This is it. We rally from this level or we are bound for a test of QQQQ 50 dma and possibly lower. For now, we take the ride, but as always, watch your back. The big resistance is 1723, followed by 1728. Support is 1708.50. A break of that will immediately get us a test of 1703.25, monthly pivot. The SOX closed back above its 50 dma, so for now, don't fight it.

Sunday, April 23, 2006

Friday was a wild day, but understand once again the power of option expiration week. QQQQ was pinned right at 42 "max Pain" (largest total number of option open interest). Now that we are done with opex, bulls must maintain this level as it also corresponds to the 20 day moving average. SPX closed above 1310.88, and that is bullish, but should we lose that support level, we could very well see a test of its 20 DMA at 1300. These are dangerous times with the ten year note above 5% and oil at 75, so tread very carefully. There seems to be enough negative press out there to possibly hold up the markets, but should we start seeing optimism while techs break down further, lookout below. A usual, pay attention to the SOX, your canary in the mine. As you can see on the chart, we closed below the previously broken downward trendline. That is bearish. However, we did manage a bounce at 516, confluence 10 day ema and 50 DMA, obviously THE level to watch next week since it is also 38.2% 2006. Should the SOX lose 516 on a closing basis, the markets could be in for serious drubbing. Should it hold, we could see one more rally pop out of this tired bull market.

Wednesday, April 19, 2006

We've had a nice pop ever since I suggested buying QQQQ at 50 dma (41.38, now 41.45) and there might be a little more to come but keep in mind this is option expiration week and any attempt to get above 43 will be quickly hammered. That could change next week, especially if oil eases, as it will one day. So for tomorrow's trading action, I suggest shorting NQ/QQQQ on a hit near 43. That would equate to about NQ 1759.50, monthly R2 and a good place to swing short. As you can see on the attached NQ chart, clear support is shaping up above the January gap open at 1737.50. Furthermore, we have a key fib level at 1739.25. Below that, bulls need to hold 1733, confluence 5 and 10 day ema. The January gap close is at NQ 1778.50, a possibility but I am starting to think we will be done at 1759, which is also 50% of that old gap (1758.50, see chart). Since the gap was closed by QQQQ already, it might not need to be a target for NQ, but I always keep an eye on these type of divergences. For now, play with the bulls, but be ready to flip it in reverse. Any long play is now on borrowed time should yields hold above 5% and oil above 70.

Impressive rally. This is still option expiration week so book your profits. SPY has call resistance at 131, which should be about 1316/1318 for ES and QQQQ has resistance from 42.50 to 43, a much broader area. I would watch weekly R2 for NQ at 1742.50 and 1739.20, an area with muliple key fib converences.

Monday, April 17, 2006

I had mentioned on Friday the following: "I would be very surprised if we don't at least get a swipe at 41.50, maybe even 41.35, an area I would buy. The 41 strike is very supportive, so look for that swing trade opportunity next week should it arise ". Well we got that opportunity today with QQQQ dropping to 41.39, one point above 50 dma. The trade was solid, although not without a few scares as oil unnerved many traders. Using NQ, you should have entered around 1697 or so. Keep stops tight and watch QM (oil). It has resistance at 70.75, weekly R2, not far from last year's highs.

Sunday, April 16, 2006
A WSJ article mentions Fed talk that rate hikes might be over, and $70 oil is quickly forgotten. The hype machine is in gear, and you know the Journal is part of the game. Play along, just watch your back.

Looks like oil wants to tag 70 overnight. Watch NQ weekly pivot at 1726.

Friday, April 14, 2006

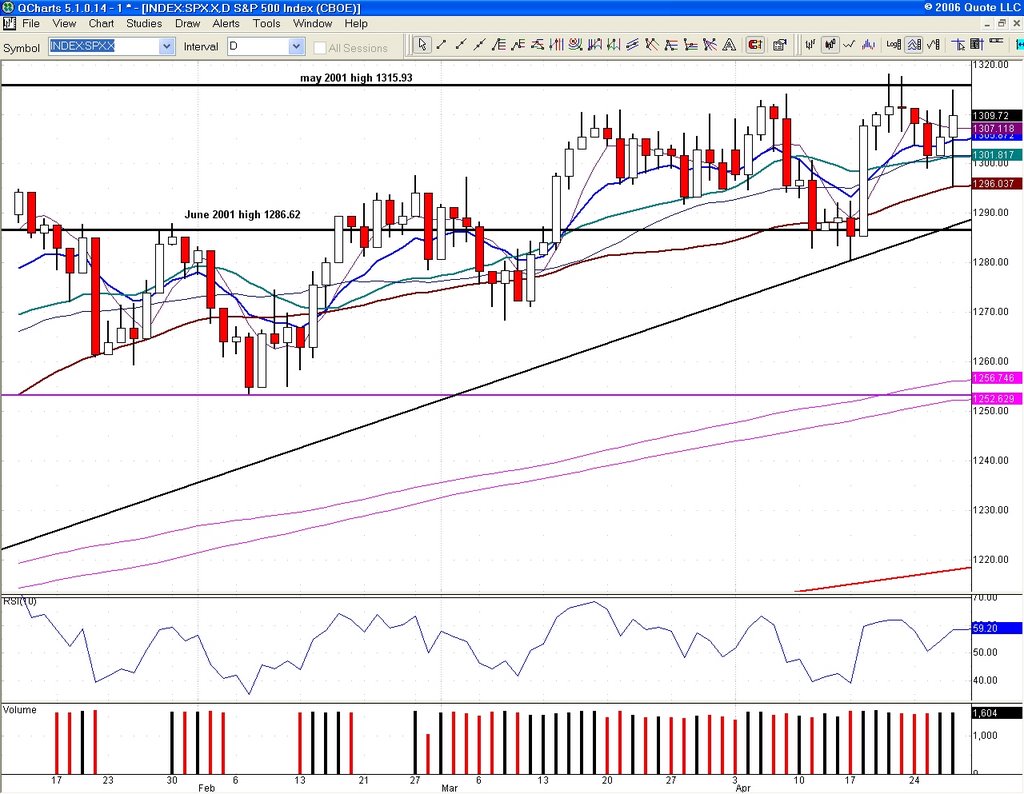
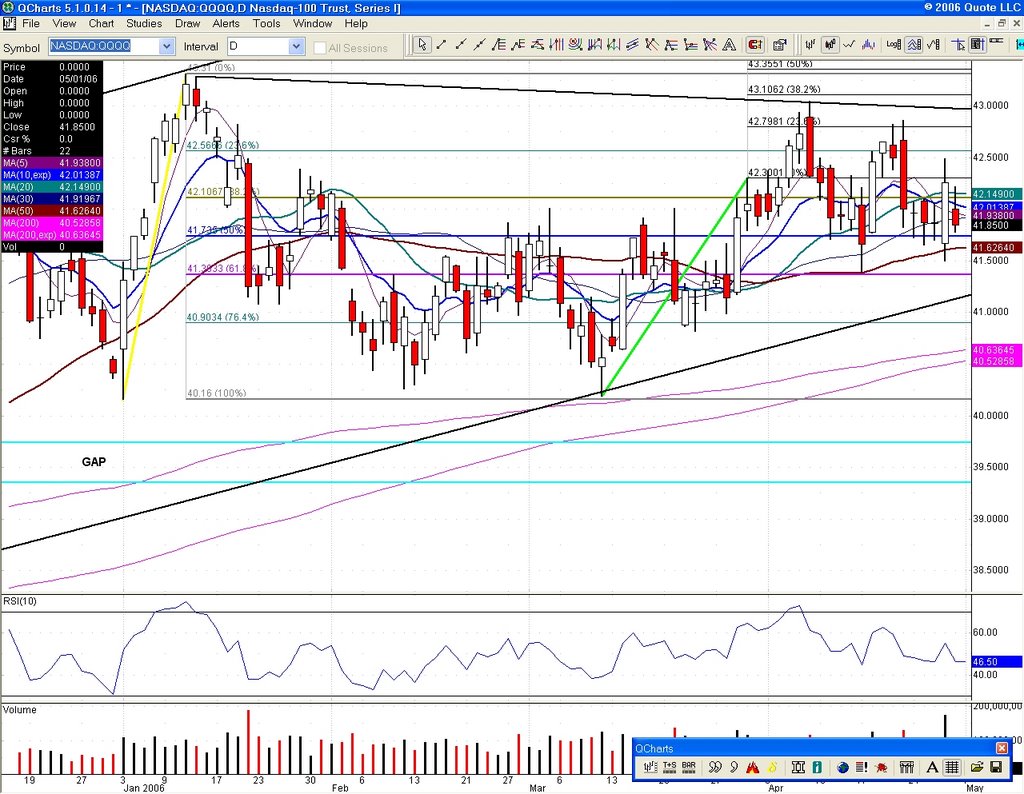
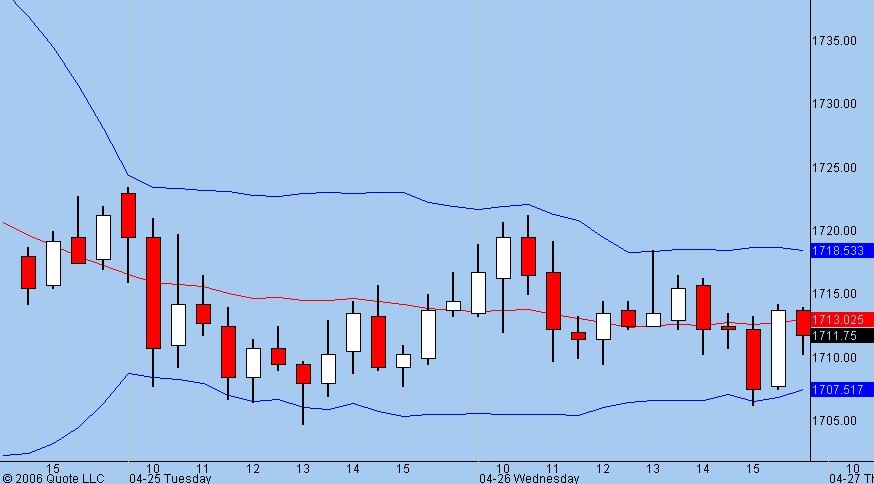
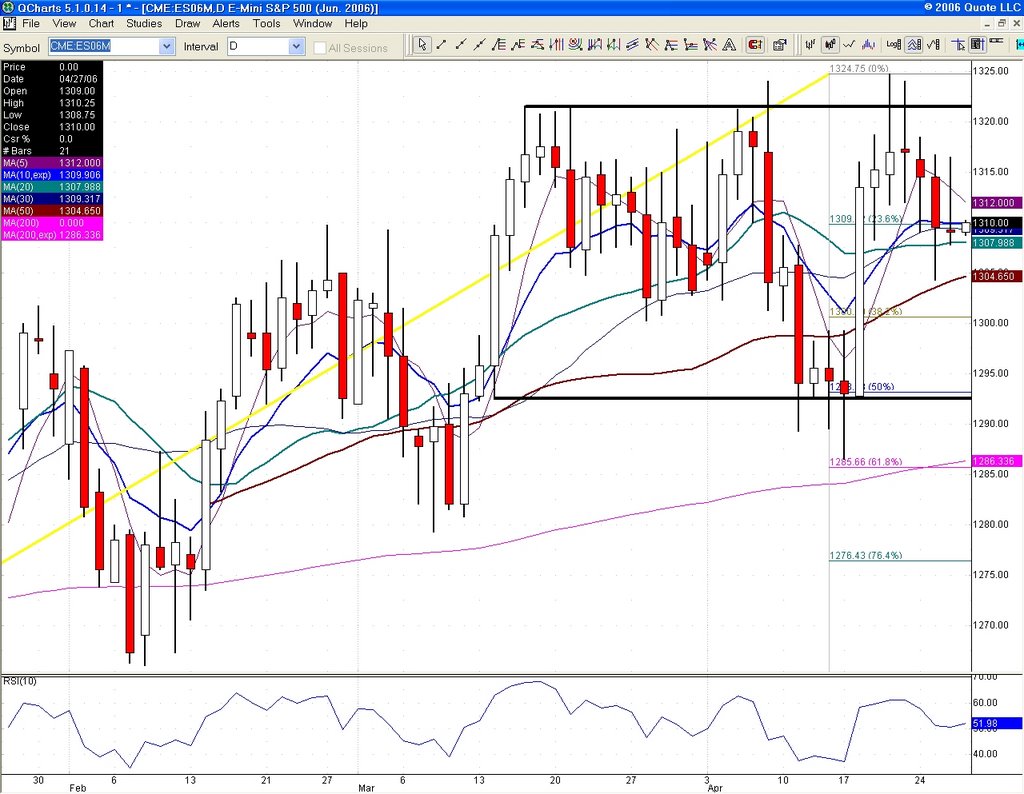
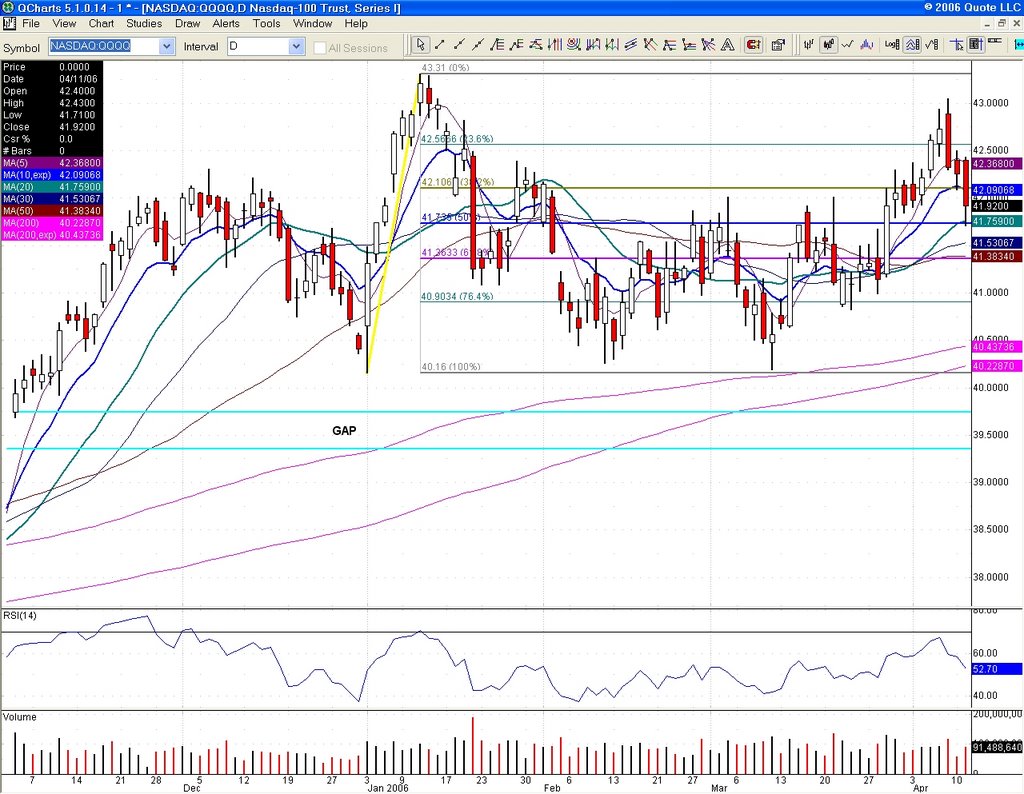
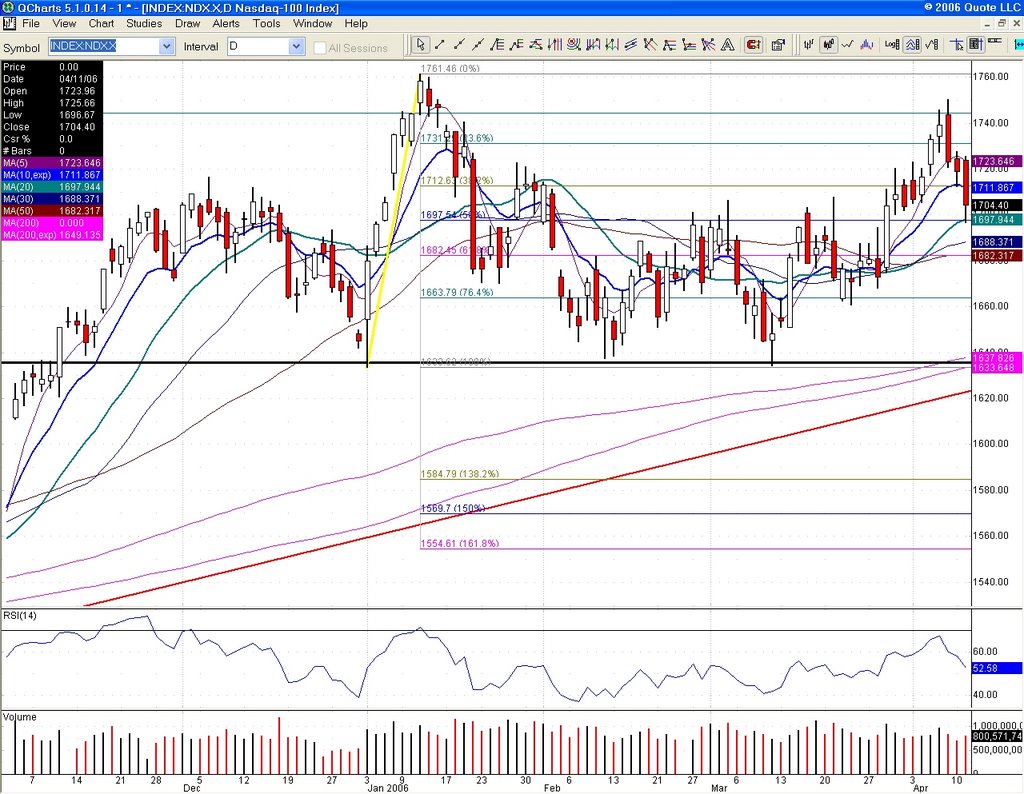
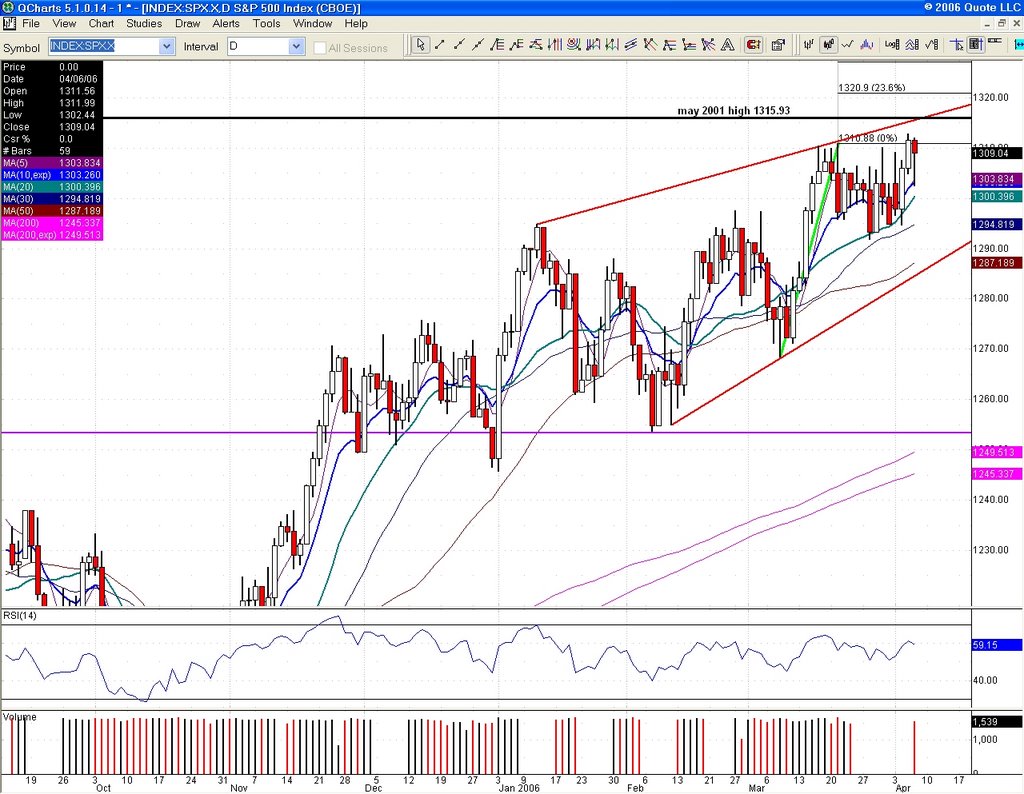
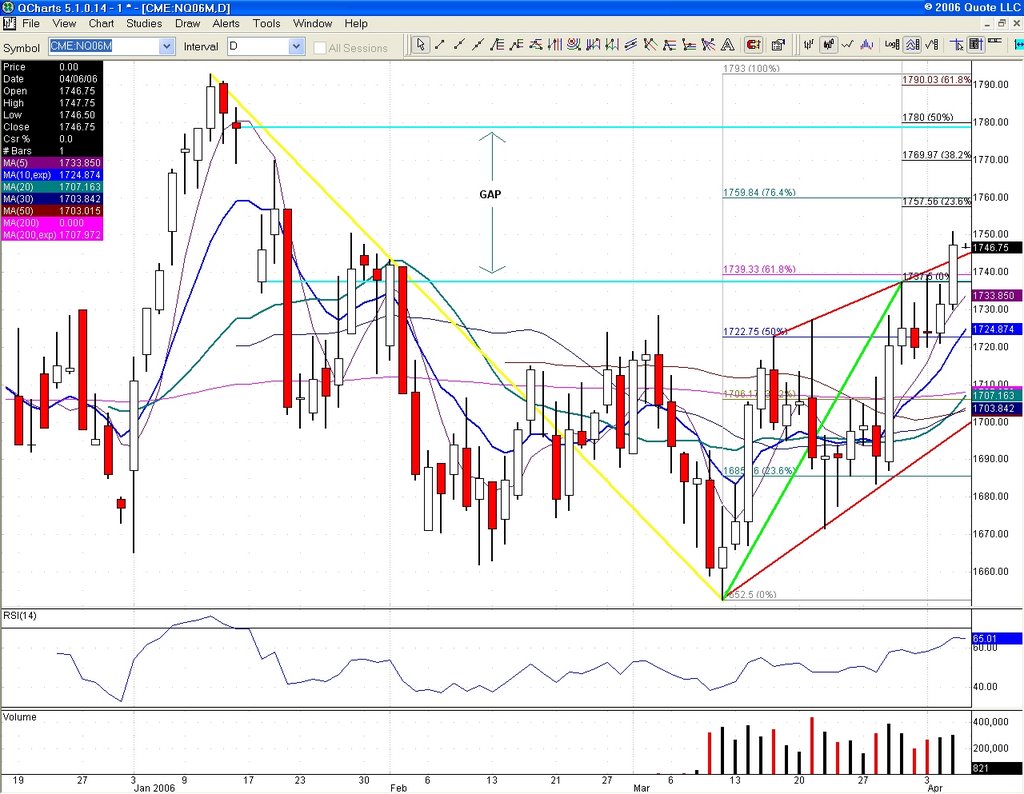
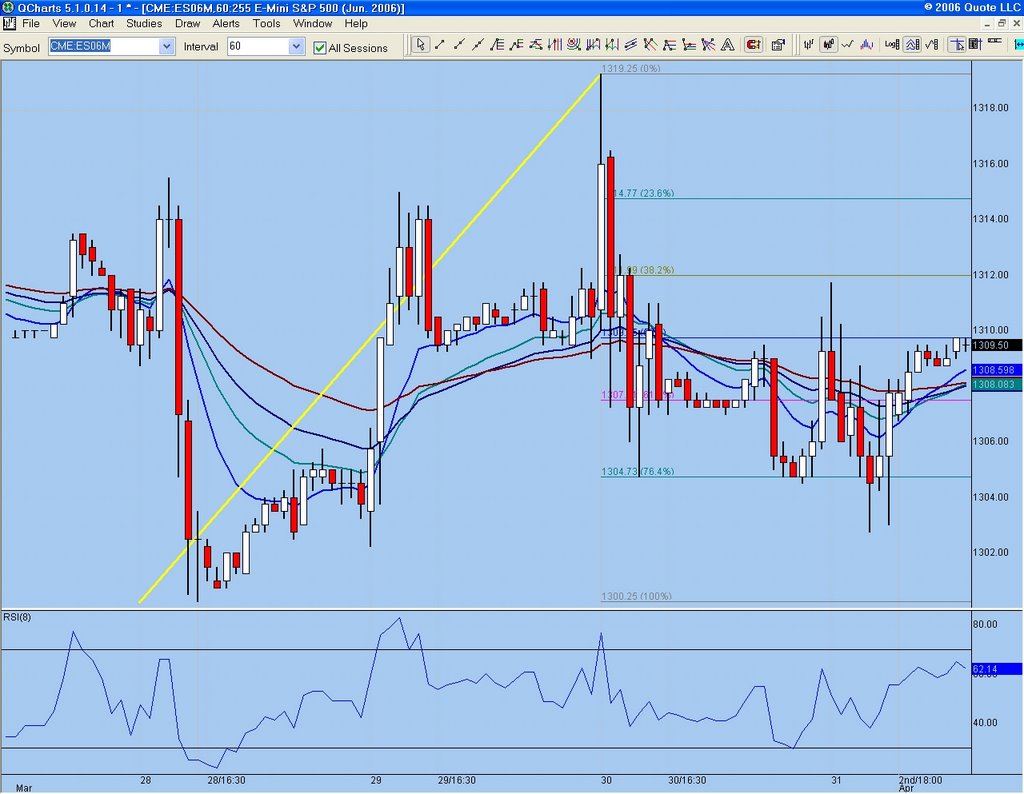
NDX is finding repeated support at trendline off March lows, now around 1700. It payed to watch that cash index on Thursday, but it is also clearly establishing the line in the sand for the markets. It is the same support line for QQQQ (41.80). Option call activity at the 42 April strike is still a .80 ratio, enough puts to hold us up somewhat, but with more calls building in the past few sessions (puts outnumbered calls last week, that has now been reversed), optimistic speculation is increasing. Initially bullish, but not necessarily so for option expiration week. I would be very surprised if we don't at least get a swipe at 41.50, maybe even 41.35, an area I would buy. The 41 strike is very supportive, so look for that swing trade opportunity next week should it arise. QQQQ 42 is still max pain and will thus remain a magnet. Curiously enough, the sentiment is more pessimistic with SPY, giving us put support at 129, right around SPX 50 dma, so I like SPX next week if ES can crack 1298.50.
One striking aspect of Thursday's session was the NYSE yearly lows at 2.5 times the yearly highs. That gives pause, so watch your step. Some real money is offloading on these intraday rallies. Yields are posing a threat to equities, at least in the near future. Watch the ten year note and the 5% level. The markets found support after initially selling off when Fed governor Kohn implied a risk of overshooting was present. But I consider that brutal pre-open selling activity to be a warning shot accross the bow. That said, any early sell-off next week could be a swing long opportunity, but these are times to collect the paycheck when it comes, so don't be afraid to lock in profits. After all, we are playing a giant game of musical chairs and you don't want to be the lone sucker, i.e retail trader, standing in the room with nowhere to sit but on your behind. I will be profiling long set ups, but I want you to start preparing for a second-half downturn in the markets and the trading opportunities it will present.
Link

Thursday, April 13, 2006
Most traders have left ahead of the weekend and the highs are probably in now. Furthermore, QM (oil) is finding a bid, now at daily highs. No one wants to be short oil over the weekend. All major indices are still trading withing Tuesday's range. ES is the weakest on a relative basis on rate concerns. Noting that NYSE new yearly lows outpace yearly highs, which means many stocks were dumped on this bounce, most likely interest rate sensitive issues.

NQ briefly went below 20 dma and tested daily S1 and pretty much hasn't looked back, now all the way up to daily R1 at 1724. Bullish above 1722.75. As profiled last night in the video wrap, watch ES 1298.50. For now, shorts are getting their heads handed on a platter.

Oil has dropped, but interest rate fears are creeping back in as the Ten yer note hits 5%. An earlier rally sparked by lower oil and good earnings has been reversed. ES must hold support at 1292.50. NQ key support is now 1716.25, 20 day moving average and trendline suppport. Bullishness in LRCX is offsetting some profit taking in AMD. Remember that techs and small caps perform better in a rising rate environment, so pick your battles. Awaiting jobless claims and retail sales data at 8:30 am. Keep an eye on bond futures.

Wednesday, April 12, 2006
When everyone agrees on something, I tend to get suspicious. Oil at 70 a slam dunk? Maybe. But today is the first in six that we close below the 5 day moving average, indicating a slight loss of momentum. We could conceivably see a test of 67.65 soon. Some analyst believe all the bad news, including a disruption from Iran, is priced in and we have ample inventories to deal with it. Others (mostly oil brokerages) are screaming 75 in a week. We will just look at the chart and see what happens at 5 dma, 68.40. If oil bulls can't get that level back, you know mid-67 is right around the corner. Whether or not that constitutes a minor pullback or the start of a real correction, that is not for us to decide. We trade charts, not emotions.

"Day after" trading, never much fun. A look at ES action:
Watch video

It's going to be about oil today. Watch the 69.35 level (May contract). Overall news is good and if oil drops after inventories data (10:30 est), we will have a rally. The opposite holds true of course. Watch QQQQ 41.75 support. If that breaks, next level of support is 41.53 and 41.38 (50 dma). NQ futures are weaker than ES and YM so pay attention to that and QQQQ 42 resistance. Should we get another sell-off this morning, I would be a buyer of QQQQ 41.38, 50 dma. That would put NQ at 1702/1703 (50 dma as well). There is very strong put support at QQQQ 41 going into next week option expiration.

Tuesday, April 11, 2006


Rough and tumble day as various indices struggle with 50 day moving averages. Lots of false starts, but the DOW eventually closed above that landmark. SPX is just shy, but right at June 2001 high support. NDX/QQQQ have the cleanest charts with a clear bullish bounce near the close at 50% 2006 and 20 dma (QQQQ 41.75 and NDX 1697.50). The ones to watch. Oil of course is the excuse to book profits, but realize that QQQQ and SPY are right below next week's max pain option open interest levels (42 and 129) and we should play around these numbers until then. ES came very close to weekly S2 (1287) so support levels are lined up as it bounced rather strongly from the 1289.25 low. NQ did some tap dancing around its 20 dma (1715), but eventually managed a close solidly above. The SOX is resting right below its 20 dma (505.60) and that is the wild card. Now we just wait for oil to cool off a little. QM/CL backed off from weekly R2 at 69.35, but a move above would set up a test of 70. Until that happens, don't bet on Armageddon scenarios too much.

Sunday, April 09, 2006

Let's look at the rather complex chart of NQ (NDX futures). I have mentioned a few times the January gap, yet to be filled. Friday's sell-off occurred at or near 61.8% of gap, however we managed to close within the gap (open is 1737.50) and right above 61.8% 2006 (1739.25). Very important support area going forward, but we have a little leeway in light of QQQQ option activity. Put support is building at QQQQ 42 strike for April option expiration two weeks from now, so bears should not assume a new phase has started in their favor as far as techs are concerned. Yes, we have heavy call resistance at 43, so the range could get very tight as we enter an important earnings season. My guess is we probably take a swipe at NQ 1722.75, but I think bulls hold the line there, although a quick attack of weekly S1 at 1718 is not out of the question, that would put QQQQ close to 41, strong put support. As long as bulls achieve closing prices above NQ 1722.75, they still hold the aces, regardless of intraday volatility. Remember all those lowered earnings guidances at the beginning of the year? You can bet many companies will handily beat. SOX above 511 on a closing basis is also key. There will be many shorting opportunities as I think real damage was done, especially to ES and YM, but if we start hitting weekly support areas, I would flip long. ES and YM are the weaker markets, both closing below their respective 20 dma's, so I am inclined to stick to NQ if looking for long plays, but be patient, as bulls could have a few rough days ahead. Basically, short ES and YM rallies that stay below 20 dma's and hit NQ longs that stay above 1718 or so. Use tightstops and don't get married to a position. If the selling really starts kicking in, don't be a hero, go with the flow.

Friday, April 07, 2006
It all fell apart. ES is solidly below 20 dma and NQ barely holding on to 1739.25 support after it lost 1745. This doesn't mean the rally is over, just that bulls will now need some help from earnings.

Intraday: I profiled SPX 1315 and ES 1323.50 last night, well we hit SPX 1314.07 and ES 1324 (pre-open) and promptly sold off. QQQQ also hit that call resistance at 43 I mentioned and we are selling there as well. SOX has confirmed resistance at 525 and is now even moving below 50 dma. The good news was all priced in, now we need to see some earnings justify all this. Watch the NQ gap close at 1754.75, it could produce a bounce, but I think SPX 1315 is pretty much a brick wall for now. Should the gap close not hold up NQ, next support is 1745. But so far, bulls still holding up techs, ES was the better short.

Thursday, April 06, 2006

If the S&P 500 (SPX) should start breaking out to the upside, watch the channel resistance which is lined up now with the May 2001 high of 1315.93. Lots of talk about SPX 1309, but I think 1315.93 is even more critical, as we saw with the pullback at 1286, June 2001 high. Another reason I like SPX 1315.93? It would line up with ES (e-mini futures) 1323.50, monthly R1.


Updated SOX chart, the one to watch for bulls. Right now we are at 525 resistance, confluence of 50% 2006 and 23.6% 2005 October low and 2006 high. Support is 50 dma at 522 and below that 511. Important times now as QQQQ knocks on 43, an area with lots of call resistance. YM and ES lagging on rate concerns, but everything can change with the jobs data tomorrow.

Wednesday, April 05, 2006


Bullish close for the SOX and the party is on. My only concern is that we might be getting ahead of ourselves with the almighty jobs report on Friday, but if SOX holds 511 on pullbacks, the coast is clear for NQ 1778/1780 (January gap close and 50% projection March H/L). Support is now at 1737.50/1739.25, so use that for stops.

NQ closed the gap at 1732 and it's back to the races, now above 1739.25.

The rally is fading with YM losing 20 dma support at 11265. QQQQ 42.50 was hit and with all that call resistance at 43, we could have seen the highs today. For ES, the game is still in the range, buy support, sell resistance. NQ has a gap to close at 1732.

Oil inventories have created an initial bid in QM and that is putting pressure on equities, but they are holding support so far. Keep an eye on SOX 511. It's an old song, but it is the one to watch along with NQ 1739.25 now.

That NQ ADVDEC line is weakening again. Watch that support at 1737.50, SOX hit 511 and backed off again. Oil inventories are up is 12 minutes, if they drive oil prices lower, this rally could get a second leg. Right now, weekly R1 for NQ is resistance at 1743.75. Watch bonds if you are trading YM and ES.

Strong open for NQ and techs as we break throgh the 1739 barrier and enter the January gap. Top of the channel is 1743 and should provide some resistance, but if the SOX can break above 511, bulls would have won a major victory. Keep those stops tight, support is now 1737.50.

Tuesday, April 04, 2006
NASDAQ closes at new highs, but without NDX (NASDAQ 100) and SOX (semi-conductors. There are some signs of distribution as NASDAQ advance/decline line stays negative most of yesterday and today. That could mean an imminent pullback, unless the SOX decides to take charge all of a sudden. SOX 511 level is still a tough one for that index and until we close above that, I am not too excited about this rally.


Intraday update: Lots of chop ahead of Friday's job data. Ths is the chart to watch, NQ (Nasdaq 100 e-mini-futures). Clear resistance at 61.8% 2006(1739.25) as well as that yet unfilled gap above from January (1737.50/1778.50). Globex now offers .25 spreads on NQ and it is becoming a very attractive vehicle. Keep an eye on that channel we are in now. Nasdaq Advance/decline line has been negative these days and not in sync with the bullish bias. Trade the range.

Sunday, April 02, 2006

As for ES (SPX e-mini futures), watch last week's H/L fibs, with 50% at 1309.75 and weekly pivot fulcrum at 1307.50 which is also 61.8% convergence.


SOX is still a question mark. We need to see the 10 day ema cross above the 20 dma once again (501.80/502.58) and especially get that 503.60 marker back. All bets are off if we fail that test early on. At least we have end of quarter noise behind us and let's see what funds are buying now. A good one to watch will be INTC. Everyone made sure they had it off the books for Q1. Now the real play comes in. Earnings season is upon us and bulls need all the help they can get to offset rising rates. Many companies lowered expectations for Q2, so my guess is many will beat. They just better not lower guidance for Q3.


YM (DOW e-mini futures) did a sharp bounce after the close of regular trading on Friday from a low of 11162, just 2 points above 38.2% of 2006 range. That was a pretty clear signal that index could have bottomed for now. Keep an eye on 20 dma resistance at 11238.