AheadoftheNews Blog
A blog on market moving news and futures trades.
Markets sold off as the Feds gave no indication they are done raising rates. That posture, in the face of slowing economic numbers, is puzzling. Equities reacted sharply and money fled to bonds. Not quite what Greenspan had in mind, as the ten year note settled comfortably below 4%. What a surprise: the bond market does not agree with him. The markets wanted something in the language implying a neutral stance in the near future. It did not get its wish and the quarter ended with the DOW off almost 400 points from its June high. Earnings are up next and there should be plenty of volatility. Great trades ahead.
We have a nice gap to close and NDX is still below 200 DMA. DOW is way below it, so short the rallies still applies.
Wednesday, June 29, 2005
There are numerous gaps to fill below: NQ 1506, YM 10324 and ES 1196.50. NDX is below 200 day moving average again and the DOW lost the 50 day moving average at the close. The drop in oil did not help in the end. Let's face it: 57 oil is still a burden. We need to do more backing and filling at best. At worst, we head to new lows. Should oil break below 57, the bearish scenario at the open is negated. But gaps get filled sooner or later and I'm betting on one soon.
Tuesday, June 28, 2005
Oil futures broke down out of the uptrend channel started in May and sparked a rally in equities. It remains to be seen how much follow through we will have, if any. But it's clear that oil needs to get back above 59.50 soon if it wants to avoid more selling. Critical support is at 57.10.

click on chart for full size

click on chart for full size
Saturday, June 25, 2005
Watch techs next week. NQ (NDX futures) must hold 1504, or the markets have more downside. The NASDAQ bearish divergences I posted last week raised the red flags and sure enough we sold-off. My inclination is to sell the rallies the coming week. Funds will be doing their usual end of quarter window dressing and so far, it looks more like an undressing than anything else.

click on chart for full size

click on chart for full size
Friday, June 24, 2005
Markets manage to drop even further, with YM (DOW futures) hitting 61.8% projection from Thursday drop (10306). NDX closed at 1500. We should get a decent bounce next week, but I have multiple tag possibilities lower including monthly S1 at 10215. My target for oil is still 62.05, so that could give a scare if it happens.
Exited the YM short at 10390 for +221 ($1105 per contract profit). NDX is at 200 dma, 1508, and it's time to take money off the table.
Thursday, June 23, 2005
Big sell-off and the markets are finally paying attention to high oil. The level of complacency we have had is setting us up for some more selling, as bulls wasted all their ammo. Target is 10406 on the trade.
Wednesday, June 22, 2005
QM/CL August crude oil has trendline support at 57.80. There is a possibility we hit 57.08, the 23.6% fib projection from May and 10 day ema. We also have fib support off June high starting at 57.375, so there is a rather broad zone between 57.10 and 57.80. A daily close below the trendline support would be a red flag for bulls with a quick trip to 55.80 or so. The chart is very bullish and a buy on dips, just manage your stops wisely as we've had quite a run.

click on chart for full size

click on chart for full size
How the markets react with bonds pricing in a worlwide slowdown will be key. The bullish scenario is no more rate hikes and stocks move up. The bearish scenario is earnings growth stalls and we actually sell-off. Overnight traders took us up, let's see what the open gives.
A prediction that feds are almost done and overnight futures surge, eclipsing a warning from Ford. Of course, if the feds are considering halting rate hikes it's because things are not so hot. We could get a pop and drop. But don't fight the tape. Watch oil inventories at 7:30 PST.
June 22 (Bloomberg) -- The Federal Reserve will raise interest rates one or two more times and then stop because inflation is in check, said Paul McCulley, a managing director at Pacific Investment Management Co., which runs the world's biggest bond fund...
U.S. manufacturing is slowing ``sharply'' McCulley said.
Record oil prices may help slow global economic growth, McCulley said... ``We have turned to a much slower growth trajectory."
``High oil prices will stay,'' he said. ``Demand is growing robustly particularly in Asia. The world can handle this level of high oil prices, but if it were to move higher in a rapid fashion, it will be negative to global economies.''
Link
June 22 (Bloomberg) -- The Federal Reserve will raise interest rates one or two more times and then stop because inflation is in check, said Paul McCulley, a managing director at Pacific Investment Management Co., which runs the world's biggest bond fund...
U.S. manufacturing is slowing ``sharply'' McCulley said.
Record oil prices may help slow global economic growth, McCulley said... ``We have turned to a much slower growth trajectory."
``High oil prices will stay,'' he said. ``Demand is growing robustly particularly in Asia. The world can handle this level of high oil prices, but if it were to move higher in a rapid fashion, it will be negative to global economies.''
Optimism and the stock market
Tuesday, June 21, 2005
The worst word a bull wants to hear is optimism. Why? Because bull markets climb a wall of worry. We are fearless in the face of skyrocketing oil, a slowing economy, an asset bubble of massive proportions and a potential currency crisis with a deficit the defies the imagination. To top it off, the feds keep raising rates.
The VXN (NASDAQ volatility index) just reached an ALL TIME LOW today. What does that mean? It means there is virtually no risk premium in the pricing of options, a sign of tremendous optimism. Bearish advisors are back down to 20, levels that should post red flags everywhere, but no one cares or notices and the usual suspects, (you know them) just keep on telling you to buy. I say sell every rally and go to cash. COMP 2200 is a hundred points away, and that is the barrier of all barriers. It is the December 1998 high, an impenetrable level for years, because it occurred right before 1999, the greatest year of bloated excess the market has known in living memory. Hitting that level or anywhere close (I doubt we even get past 2150) with the macro circumstances listed above and historically high optimism is your clue to get out or go short. Start thinking this way. We could keep climbing, but keep enough cash around to buy the cheapest and best deal in town: puts. Right now, my best guess is DOW 10750, where we need to close a gap from March. I will keep you posted.
Link
The VXN (NASDAQ volatility index) just reached an ALL TIME LOW today. What does that mean? It means there is virtually no risk premium in the pricing of options, a sign of tremendous optimism. Bearish advisors are back down to 20, levels that should post red flags everywhere, but no one cares or notices and the usual suspects, (you know them) just keep on telling you to buy. I say sell every rally and go to cash. COMP 2200 is a hundred points away, and that is the barrier of all barriers. It is the December 1998 high, an impenetrable level for years, because it occurred right before 1999, the greatest year of bloated excess the market has known in living memory. Hitting that level or anywhere close (I doubt we even get past 2150) with the macro circumstances listed above and historically high optimism is your clue to get out or go short. Start thinking this way. We could keep climbing, but keep enough cash around to buy the cheapest and best deal in town: puts. Right now, my best guess is DOW 10750, where we need to close a gap from March. I will keep you posted.
YM exit point alert
Short 10661, lower stop to 10660.
Monday, June 20, 2005
Raising stop on QM long to 58.80 for break-even. Oil could take a dip tomorrow on some Saudi news. Even though the trend is still up, there could be some waffling ahead of inventories.
Link
June 20 (Bloomberg) -- Warren Buffett, the billionaire chairman of Berkshire Hathaway Inc., is sticking to his bet against the U.S. dollar even as a rally in the currency produced more than $300 million in losses this year.
Link
YM (DOW e-mini futures) entry point alert
Stopped out YM short for +7. Re-entered at 10661, stop 10673. All AD lines are negative so this bounce should falter into the close.
QM (light sweet crude e-mini futures)entry point alert
Long QM August contract (05Q) 58.80, stop 58.675. 50% fib projection from May high /low is 58.80 and taking the long there. Resistance is 61.8% at 59.58. 60 was hit earlier, but that is more psychological. A move back above 59.58 gives us target of 60.52.
Open takes a hit with higher oil. EBAY hurt by the Google news. Short YM 10665, lower stop to 10658. Target is 10557, 50% projection from Friday and daily S2.
Sunday, June 19, 2005
Oil above 59 and we have a live trade, now that OPEX is done with. YM short from 10665, stop 10677. Resistance is 10631 and 10648.
Saturday, June 18, 2005
Oil is getting overbought? Well, as we saw in March, overbought can go on for awhile. Should CL (light sweet crude futures) clear 59.94, next stop is 64/65. The reaction in the equities markets will be severe, not anything like the complacency that has marked trading in the past week. A big heads up here. Support is 57.20, 55.80 and 55.40. Oil bears gain control below 55, trendline support.

click on chart for full size

click on chart for full size
Friday, June 17, 2005
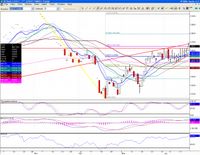
YM (DOW futures). We tapped the trendline resistance and I took a short at 10665. I don't think the rally is over and we could close that March gap which incidentally coincides with weekly R2 at 10801 (DOW 10750/10760). For now, we should get a corrective pullback Monday and a swing trade.
click on chart for full size

click on chart for full size
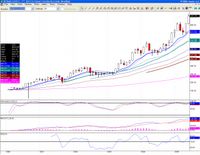
The news on housing this morning was good and maybe it's time to sell it. Getting just as toppy as the price of your home, the Housing Index (DJUSHB) has now catapulted to 10 times its value since early 2000, as a colleague of mine (Keene Little) recently pointed out. Keep your home, but do yourself a favor and at least dump your REIT's.
click on chart for full size

click on chart for full size
YM (DOW futures) entry point alert
Short 10665, stop 10677.
It's fashionable to disregard low VIX readings these days, but here we are again at decade lows. Last time we went down there was April 12th and the DOW dropped a cool 500 points soon after, so I would not dismiss this repeat event. Yes, the DOW was in a bear flag at the time, but it is now in a rising wedge, which can be just as bearish. Just in case, we are short over the weekend.
Thursday, June 16, 2005
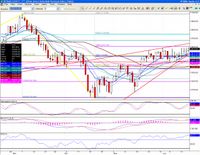
Rising wedge for the DOW with resistance at 10640. Same pattern for SPX and usually bearish. Wait for a hit of the trendline to go short. If we break out above, unlikely but possible, we have an old gap from March to fill at 10750 where I would expect some serious selling to take place. The markets are basically ignoring the constant bid in crude, but not for long. The economy is in no position to handle +55 oil, no matter what the pundits say.
click on chart for full size

click on chart for full size
Wednesday, June 15, 2005
Oil futures charged early on and the markets almost fell over the edge, giving us a great trade with QM. As crude eased, equities did a nice turnaround, especially after the SOX (semi-conductor index) bounced off the combined 200 and 50 day ema (chart). The DOW is still stuck under 10590, pretty tough resistance so far. August gold futures showing signs of upside breakout. This being option expiration week, it's hard to get a clear picture, but bulls and bears alike must be wondering what it takes to break out of the range. Right now, bulls have a slight edge as they refuse to let go, but if oil stays above 55 much longer, that control will evaporate.

click on chart for full size
click on chart for full size
Exited July crude long e-mini futures (QM) at 56.60 for +4 profit ($2000 per contract). The target was 57, but this is good enough.
Tuesday, June 14, 2005
August gold futures back below the trendline resistance and so far, the breakout failed. A close above 430.50 would signal a reversal of the downward trend and higher prices. Another failure at 430 will put an end to this rally. Support is 427.80, 426.50 and 424.50. CPI numbers out tomorrow and will be market moving for all, including gold. Watch yields and the dollar.
July light sweet crude oil futures (CL/QM) hanging on to 55 and we are still long from 52.60. Tomorrow we have inventories and a very volatile session. Raise stop to 53.60, lock in +1. Target is 57.
Stopped out YM short at 10612, +3. Option expiration week players are running stops with ease due to low volume and one has to be patient.
Monday, June 13, 2005
Triple top for the DOW on the daily chart and these hits with immediate pullbacks are not healthy. Techs are flashing warning signs as well: the SOX did not participate today and NASDAQ trading between the 10 and 20 day moving average, whereas DOW and SPX above both. This divergence is bearish, since techs were the leaders. A close by the DOW above 10600 negates the bearish scenario.

click on chart for full size

click on chart for full size
YM (DOW e-mini futures) entry point alert
Short 10615, stop 10625.
Weekly R1 is 10618 and we did a perfect 100% fib projection off Friday High/low up to 10627.
Weekly R1 is 10618 and we did a perfect 100% fib projection off Friday High/low up to 10627.
Gold update
Sunday, June 12, 2005
YG resistance profiled on 5/29 has now come into play at 430. Should we fail at the trendline, the downward trend remains intact. Key support is 422/425 area. RSI bearish divergence starting to appear on the daily chart, making a lasting break above resistance somewhat unlikely. A close above 430 would be bullish, so watch that level.

click on chart for full size

click on chart for full size
Market Wrap
Friday, June 10, 2005
Clean hit early on of YM daily R1 and we proceeded to methodically move down to S1 for an almost 100 point range. It was a nice trade if you caught it. The GM and INTC news gave hope initially to dip buyers and some pain to shorts, but it didn't last. Crude jumped up to 54.95 and yields finally got it that Greenspan is not done. The end-of-day drop in crude saved the day for bulls, settling at 53.54. NDX found support at 50% 2005 H/L (1515), providing hope for bulls next week, however 1543 must be regained on volume to before we can call this rally back on track. As I mention below, I'm not convinced.

click on chart for full size

click on chart for full size
Equity pc ratio at .47 today. Everyone buying these dangerous dips that take us to the edge of the cliff.The YM monthly pivot is still on my radar at 10406. I think the threat of higher rates could take over soon. So don't count me into the bull camp quite yet as long as NDX is stuck below 1540. I just don't envision a very strong consumer going forward with higher oil and higher rates, so all this optimism is suspicious.
If you took the oil trade long at 52.60 as profiled on Tuesday (target was hit Wednesday), you did well. Now trading at 54.40 ($900 per contract profit). As for equities, the Greenspan storm has passed and we need to watch bonds in the next few days. The equity rally off April lows is in a large part due to the perception that feds are done raising soon, but the testimony indicates otherwise. This could have bearish implications going forward if we add rising oil to the mix.
Some "sell the news" with INTC it seems, but don't expect that to last. The stock is hot. However, lack of an INTC rally on Friday will spur more profit taking elsewhere.
Remember to switch to September contracts today for Globex and ECBOT.
Some "sell the news" with INTC it seems, but don't expect that to last. The stock is hot. However, lack of an INTC rally on Friday will spur more profit taking elsewhere.
Remember to switch to September contracts today for Globex and ECBOT.
Tuesday, June 07, 2005
Oil update: CL July contract has convergence of two key fibs at 52.60 as well as 50 day ema (52.55) and that will be very strong support, if the 50 day sma support breaks (53.35). I would be a definite buyer at 52.60 and there is a chance that area could be visited soon, as the daily cycle showing signs of rolling over. The overall uptrend is firmly in place.

click on chart for full size

click on chart for full size
The early morning rally was sold pretty hard. This is usually a sign that big money is dumping rallies and protecting profits, especially if the leaders, in this case techs, are the victims. YM needs to get back above 10532 and stay there to get bulls going again. As for techs, NQ dropped the 1555 level like a hot potato and the NASDAQ could not hold on to the key level of 2076 and is in danger of losing the 10 day ema at 2066. For now, sell the rallies. If the TXN after-hours good news is sold tomorrow, expect more downside as that would indicate a temporary top. However, be aware that INTC could deliver a one-two punch to bears on Thursday. That company is firing on all cylinders. Conservative traders might want to step aside for a day or two. Oil inventories due in the morning and will be market moving as well.
Monday, June 06, 2005
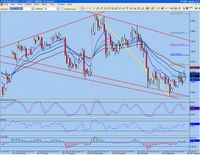
30 mn YM chart, clearly defining the new downtrend channel. with resistance around 10540 and support at 10430 and 10422. With equity pc ratio at .50, seems everyone bought the dip today thinking that was it. I don't think it is, but we shall see what the charts tell us tomorrow.
click on chart for full size

click on chart for full size
Buy to close trigger was hit at 10432, for +125 on the trade ($625 profit per contract). The low of the day was actually my trigger. How often does that happen? I had given myself a point above 50 day ema, and it doesn't get any closer than that. This is why I love to trade YM, by far the most technically precise instrument out there with great spreads to boot. We are flat for now.
Lots of support around 10429 area. Daily S1, 20 dma and 50 day ema. I will put a buy to close around there for now. Ultimate target this week is still 10375, but we could ge a few bounces first. The markets are not going to like oil above 55.
Short 10557, stop 10555, buy to close limit 10432.
Short 10557, stop 10555, buy to close limit 10432.
Sunday, June 05, 2005
Futures show oil still on a bid, now above 55. I see little reason for stocks to rally with conviction tomorrow and bounces will most likely be sold. Target remains YM monthly pivot at 10375, 100 points further down. I would go long there, especially ahead of Intel's update on Thursday. Shorts should cover in front of that. Intel has disbelievers but I am not one of them.
Friday, June 03, 2005
Week recap: YM +74. Open position: Short 10557, stop 10555 (+76 unrealized). I'm holding this trade over the weekend. Monthly pivot at 10375 is in sight, although it will all depend on techs and NQ's ability (or inability) to recapture 1555 (61.8% 2005 H/L). More over the weekend.
YM short 10557, lower stop to 10555. Free ride now, let's see if it sticks this time. We broke below weekly pivot of 10517 again and NQ is challenging 1555. Daily pivot is 10547 and should act as resistance.
Thursday, June 02, 2005
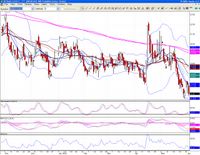
VXN updated chart (Nasdaq volatility). B-bands opening up, signaling wider moves ahead. We hit all time lows last week. Time for a reversal, especially since we dropped from the 70's in 2002 to the low of 14.47 of Friday. The bull is getting long in the tooth and this is a further nail in the coffin. If conservative, you might want to wait for a move above 17 to start shorting the market. Others can start testing the waters, using sound risk management. Futures trades are best for this aggressive strategy, since you can control risk almost around the clock.
click on chart for full size

click on chart for full size
Well, everyone is bullish. Everywhere I look, every website etc... I'm bullish as well, but on oil. 50 dma held up on the drop and is support (53.40). Lots of talk of retreat from high of 55.40, but if this were a stock, everyone would be screaming buy, buy, buy.
Let me see: slow job growth tomorrow and higher oil? Mmm. Equity bulls should not be so cocky IF that unfolds. They are of course, VXN (Nasdaq volatility) down in the gutter again. The best deal in town is long puts, and you can even slap in a few months, it's the cheapest it has been EVER. And it's not for a reason, it's because option sellers have forgotten what a volatility premium is. They are about to find out, as the chart starting to build a base and is signaling an end of the 26 month bull. Would you sell a naked put six months out at these risk premiums? Be my guest.
We have one blast possible, to 10603, now both day r2 and week r1. After that, an extreme situation has us closing the 10781 gap, but dream on if you think there is much life above that. Tight stops and good risk management until the hook is set.
Trade recap: YM: +66.
Interesting day. Oil could have derailed the markets further but it was not the case. Maybe some see the rise as over. We hit a high of exactly 55.40, my target (see 1:15 am post) and I almost entered a short there, but there's more upside, I think. Yields are still dropping and basicall money is going to stocks, where else is there for it to go? But I'm trying to find equity short entries because I think we are due for a very strong pullback any day now, target YM 10375. After that, I will think long again. Maybe.
Interesting day. Oil could have derailed the markets further but it was not the case. Maybe some see the rise as over. We hit a high of exactly 55.40, my target (see 1:15 am post) and I almost entered a short there, but there's more upside, I think. Yields are still dropping and basicall money is going to stocks, where else is there for it to go? But I'm trying to find equity short entries because I think we are due for a very strong pullback any day now, target YM 10375. After that, I will think long again. Maybe.
YM entry point alert
Short YM at 10554, stop 10571.
YM exit point alert
Exit long at 10553, +13.
YM entry point alert
Long 10540, stop 10532.
YM exit point alert
Exit short at 10540, +8. There's a bid at the turn.
YM entry point alert
Short 10548, stop 10560.
YM exit point alert
Exit long at 10537 -6
YM Trade Entry Point Alert
Long 10541, stop 10531.
YM exit point alert
Exited short at 10536, +51.
YM exit point alert
Short 10587, lower stop to 10560, lock in +27.
Oil is holding up above 54 after the release of inventories and this trade could get some mileage.
Oil is holding up above 54 after the release of inventories and this trade could get some mileage.
NQ (Nasdaq 100 e-mini futures) needs to hold 1555. Pretty much the line in the sand now, or we roll over.
YM exit point alert
Short 10587, lower stop to 10572, lock in +15.
If we break above May highs of 10569 again, we have upside risk to 10597/10603.
If we break above May highs of 10569 again, we have upside risk to 10597/10603.
YM exit point alert
Wednesday, June 01, 2005
Short 10587, lower stop to 10580, locking in +7.
The stop is above May high of 10569 and old double top in April (10578).
The stop is above May high of 10569 and old double top in April (10578).
Nymex crude broke out to the upside and closed at 54.55. Equities tried to hold on to gains, but it was too much. The trade was a given, short the rally. The feds might be almost done with tightening now that the ISM was low as well, but that might have already been priced in last week . What was not priced in was a 4.50% rise in oil .
YM entry point alert
Short YM at 10587, stop 10607.
Ym exit point alert
Stopped out, +13.


