AheadoftheNews Blog

A blog on market moving news and futures trades.

Friday, June 30, 2006

NQ did its job and closed a hair above 50% June. After the close, the AAPL news was pared down by analysts and the stock could rebound on Monday. I am still looking at NQ/NDX/QQQQ testing 50 dma at some point.
Link

NQ needs to hold 1591.25. That's 50% June and would keep bulls very much alive going into Monday.

End of quarter dressing, Russell rebalancing, higher oil, it's all a little too much, but so far not too bad a showing considering the huge rally yesterday. I still think those QQQQ 39 calls will hurt eventually, or at least slow things down and I suggest getting out on a test of 50 dma next week at 39.50 or so, if bulls get so lucky.

QQV was the canary in the mine. Everyone expected techs to fall apart, but we have been holding weekly R1 for NQ and it even looks like a closing rally is building as Nymex draws to a close. Classic pre-4th action.

WASHINGTON (MarketWatch) -- U.S. consumer sentiment improved in June as gasoline prices moderated, according to media reports of proprietary research from the University of Michigan.
 
That says it all. Gasoline is going up, so the consumer is expected to change his tune as the summer rolls on. There is no doubt that oil is hurting the follow-through for techs, but if NQ can hold on to 1595, it has a chance of closing higher. Again, watch NDX 1590, the 20 month MA. It is key for bulls to close June above it. Right now, QQV working in favor of such a scenario, but not TRINNQ or VXN. Biotechs are holding up the Q's right now.
 
 
Link

Germany moves on to the semis. Back to the markets, and NQ is laboring under the weight of 74 oil. The SOX needs to hold on to 443, 10 day ema. 

Argentina/Germany being decided on penalty kicks. I don't think anyone in Europe or South America is watching the markets.


NYSE well above 2004 trendline now, but has a pretty sizeable obstacle at 50 dma (8202). Keep an eye on that index. It has held up pretty well.

Everyone jumping in on those QQQQ 39 calls, 100K more than puts. That is going to be hard to overcome for bulls. NQ weekly R1 is resistance now. Oil is definitely hurting NQ, but helping SPX stay above 2003 trendline.

AAPL is a big drag on NDX as many worry the option problems will spill into others. QQV is red, giving some support, but VNX and VIX signaling some pressure. TRINS are above 1.

NQ is finding some support at 50% June H/L. (1591.25).

NQ needs to hold 1595. Watch that trendline from 2003 for SPX, now at 1270.

Nasdaq new yearly highs 59 versus new lows 12, NYSE is 57 to 14, the kind of ratio we haven't seen in a while. TRINNQ down at .55. That is the bullish case. But VIX and VXN working on a bid. Advance / decline lines are solidly bullish for now. Economic news is somewhat supportive, with no pick up in inflation. The oil bid is not helping NQ as are all those calls at QQQQ 39. Option sellers are trying to push the Q's down.
Link

ES resistance is 50 dma at 1288.50.

Thursday, June 29, 2006
Overnight bid in oil could hurt the open for NQ.

There is some danger developing overnight with the AAPL news. I'm not a fan of that stock going forward, but it does carry weight with NDX.

The more pessimism and disbelief you read out there, the better it is if you are long. That is just how the markets work. I am not seeing that much pessimism in index options, but you never know what can happen when all those call sellers have to cover. They thought it was easy money, but it might not be the case. Could we actually get a reverse scenario from the terrible beating put sellers got in May? Time will tell. Let your winners ride is still the rule, just watch the charts and the levels I have written about. They are key.


SPX managed a surprising close above the old 2003 trendline support (1270; see black line weekly chart) and is stalled right at 10 weekly ema. If bulls can manage another SPX close tomorrow above 1270, it could seal the deal. There could be some kind of hangover tomorrow after so much buying, but it will be the close that will tell the story ahead of the weekend.


The DOW monthly chart shows that the 20 month MA was indeed the low and what a strong monthly candle this is, right back to the 5 month MA. Support is now at 10 month ema, 10972. 50 day moving average is clear resistance at 11191. That is the test for DOW bulls going forward.


Remember my post yesterday about NDX and 20 month MA? Well here we are, right at that level (1590), after a scary drop below. If June closes above the 20 month moving average the bull will still be alive. Bruised, but alive. What a comeback, all in 24 hours. Now remember those QQQQ 39 calls, they could come to haunt bulls later next week, but for now, it's party time.


Solid day taking NQ a whopping 50 points high to low and only stalling at 61.8% June high/low. Support is now weekly R1 (yes, R1) at 1595. Quite an accomplishment. SOX is still being held back by its 20 dma, so that is the battle for bulls going forward. The power of this rally indicates more than just short-covering. It was broad based and should have enough legs to carry through early next week.

I mentioned yesterday I expected a monster rally into the 4th and it sure looks like it is happening. I would not even entertain the thought of going short above NQ 1580 today.

Bulls have it if they hold NQ 1573. For the COMP, that level is 2130 and QQQQ it's 38.23 (May lows AND 20 dma).

NQ 20 dma at 1573 should be supportive if bulls mean business here.

NYSE Adv/Dec +1900, NQ +1400, DJ +27. TRIN at .68, TRINNQ at .69, VIX and VXN at low end of range. Can't put my hands on anything bearish yet.

Internals are unwaveringly bullish on this drop. Bear trap?

Yields find a bid and NQ 1581 is proving tough, as expected. Here comes the bear counter-attack, or just weak hands on the long side. Let's see what punch they carry.

Watch QQQQ 38.55 (23.6% retrace 2006). A close above is key for bulls.

Internals are getting stronger. NQ now at critical test of trendline 1580. A break above buries shorts.

Big drop in yields. This is bullish.

ZB ticking up.

If we take off, watch NQ 1581, trendline R and just above weekly pivot. If short, stay out of the way if we move above. If long, watch 1558 and 1551. I would exit any long below 1551. I am focusing on NQ, it will be the leader.

One thing for sure: I would be very careful if short today. Internals are staying pretty strong.

Not much letting up into the announcement. Somebody wants a 4th of July rally pretty badly. I don't think the Feds will shed much light anyway as they might wait until the July 19th hearings.

Take note of INTC being heavily accumulated above the 50 dma.


SOX daily. Nice hammer and lower low with bullish divergence. Needs to hold 429 today.

NQ gap is closed, leaving ES still open at 1257.75.

NQ at 1559, gap close is 1558.

New year highs are climbing for the Nasdaq but the tension is building at QQQQ 38 as TRINNQ moves up above 1. If bulls can hold here without even touching the gap, it would be quite show of strength. PC ratio is at .55, nicely bullish.  

Here comes a move into the morning gap.

The markets are ignoring some extremely dangerous news coming out of the middle-east with Israel on the verge of an attack against Syrian leaders. This could escalate over the weekend. Once the Fed noise is over, attention will shift to this event if it is not resolved quickly.
Link


Bulls need to be a little cautious here as this is a support zone for the VIX.

NYSE Advance/decline +1800, TRIN .80, VIX -1 at 14.80, new yearly highs at 52 and new yearly lows at 62. A little bit for everyone, but bulls have a solid edge. Keep in mind that early rallies these days have not held up into the close, so this will be a critical test of any likelihood of a summer rally.

There is a pretty good chance QQQQ will get into this morning's gap before the Feds announcement. 37.79/37.96. For NQ, that would be 1558/1560.25. Note that NQ 1558 is not only gap close but also 23.6% I mentioned earlier. Not a bad spot to enter a long if you are not in, but be very conservative with your stops and take no risks. Resistance is firming at 50% current June bounce (1571).


NQ 1558 is 23.6% 2006 H/L and current support. Resistance is a hair belwo 20 dma at 1572. Since weekly pivot is at 1577.75, you can see where the wall is. ES is stronger on a relative basis thanks to energy and is now trading above the 20 dma at 1260. Key support for ES is 1250, although a break below 1258 would raise the red flags. Very often the first move after the Feds is a headfake, so watch yourself. One caveat. The first few ticks in the initial second or two usually shows correct direction, it is qickly reversed and a move is set, drawing in the wrong crowd, then a reversal back into the first tick direction. That is a little too dangerous for most players, so try to be in with a cushion or stay flat.

Watch NQ weekly S1 and weekly pivot, 1551.25 and 1577.75. These will be your early breakdown/breakout detectors going forward. I prefer to keep an eye on NDX futures during these events.

Strong rally out of the gate on the GDP numbers from last quarter. These are lagging numbers and do not reflect the slowdown experienced in the current quarter, but nevertheless it's a switch in tone where economic strength is now welcome, not feared. We will find out shortly what is truly priced into the market. If you are long from yesterday's lows, cinch up your stops to even and let the dice roll. As for fading this rally, it's a play, since fear should creep in as we get closer to decision time.

Wednesday, June 28, 2006
Large amounts of QQQQ calls have been flying around at 38 and 39 July strikes. This can be a warning sign for bulls as too many traders lean on the long side just ahead of a major news event. The 37 and 38 strikes still look "put" supportive on aggregate, but the 39 strike is starting to look like a wall. However we are still three weeks away from opex, which means we could still rally past 39, before settling down. My guess is any rally that goes as far as QQQQ 50 dma (39.75) will find serious sellers. But the ride up to that, should it occur, would hurt quite a few bears. Just don't fall in love with it.
Link


If I had to pick one chart that sums up the day and holds the bulls together for now it is the weekly chart of the SOX (semi-conductor Index). As you can see, we did a critical bounce at 200 week moving average and trendline support off 2004 low. It is vital we close above these levels going forward. It is all up to the Feds now and how much bad news has been priced into stocks.

Watch weekly S1 for NQ at 1551.25 for support going forward should this bounce have legs.

Stock of the day is INTC, green all day and bouncing right back to 50 dma. A close above is very bullish (18.57).

Internals have improved and it it seems NQ 1536.75 is as low as we will get. Stops should be place at 1532 if long. The kicker was COMP holding 10/31 low and SOX holding 200 weekly MA.


A look at NYSE DAV/DEC line and you can see the same pattern as in October, when an index low is put in within a rising low for ADDEC issues. It's a bullish divergence that rarely fails.

Watch 10/31/05 COMP low at 2094.37, seems supportive at this point.

The TRIN is rapidly rising and we could get that test of lows.

I am shifting some of my time into intraday posts here as opposed to the monitor, at least for now. Time stamps can be found on the right column under "Posts". Just click on the relevant item and it will inform you of the time. (All PST, Pacific Standard Time). I suggest you use the feeds (see XML, Yahoo, Google buttons) an easy way to get updated, although the upcoming auto-refresh feature might be the easiest. Let me know.

Oil still finding resistance at 50 dma (72.45), but a close above would be bullish.

The NQ low at 1536.75  came very close to weekly S2 and could be it, especially if SOX 425 holds. My concern is still ES and that gap, but since it came very close to its weekly S1, it could have put in a bottom today. TRINNQ (Nasdaq) is not as bearish as the Advance Decline line and could signal the worst is over. I expect a monster rally any day, right into the 4th. I could be wrong of course, but it seems the bad news is getting thoroughly priced in.

The bounce looked a little suspect, we should get one more stab at lows and then build a more solid bottom. Weekly S2 for NQ is extremely supportive and does not occur very often. At 1534, it is a good place to step in long, using tight stops, should it occur with at least 50% June gap close for ES (see previous chart).

Buyers have stepped in front-running weekly S1 for ES and weekly S2 for NQ as well as the ES gap open. It remains to be seen if that is it, watch ES 1255.50 resistance. NQ resistance is at 1551. The SOX did indeed find support at 200 monthly MA.


Let's go a little more macro. NDX monthly chart shows the same pattern as 1998, should we move back up to 20 month MA before the end of the month. This could very well happen if the Feds spark a rally. I am not quite ready to count this bull market out, as many are. I don't see where they get all that certainty. In fact, the more talk about a collapse, the more I think long.


That ES gap is like a magnet. (1241.25/1245.25).


Keep an eye on the SOX 200 weekly moving average, currently at 425. Readers who have been following my posts here and elsewhere for a few years know how important this level is.

Option related downgrades hit the SOX, so expect some weakness today, but hopefuly not too much more as these analyst calls often come late in the game and are already priced in. NQ has weekly S2 at 1534, we could get a quick stab there and if it is with a bullish divergence, pick it up. Watch ES and a possible move to 1245, maybe 1241.25, gap close as mentioned yesterday.

Tuesday, June 27, 2006
QQQQ could not hold on to May lows at 38.23 and as I wrote on Sunday, that sets up a June gap close at 37.63. That is now done and some, leading me to believe that ES (SPX e-mini-futures) will follow suit soon and close its gap at 1241.25, or very close. Keep in mind that today's sell-off is being exacerbated by end of quarter window dressing. No fund manager wants to show he is holding the May/June dogs. I still expect the 2006 lows to hold ahead of the Feds.

As we approach the closing hour, no real bounce at NQ gap close, which might set up more selling. It is entirely possible now that the ES gap close at 1241/1242 is being targeted. My guess would be a little higher at 61.8% and 1244/1245. In any case, should NQ drop 1545.50, look for ES to hit 1245. The SOX has made a new low for the year, albeit with a bullish divergence.


Gold started a rally earlier but just got spanked below the 20 dma. Frankly, the only reason to buy gold now would be if you believe Feds will signal an end to hikes. That could be inflationary in the eyes of some. Other than that, commodities are being sold on rallies, so be careful.


Intraday update 3: SOX is critical now testing June lows. Hedge funds know where all the stops are and they are definitely hitting them. Is this the final scare before the Feds, or the start of something more ominous? Hard to tell, but if yo are testing the long side, watch that NQ gap close at 1545.50.

Intraday update 2; NQ loses 1560 support and we head straight to weekly S1 at 1551, which is a buy zone if it holds. Gap close is 1545.50, but I would nibble long starting here at 1550 or so. QQQQ gap close is 37.63, we hit 37.68, close enough to start hitting it. Drop in the ten year note, should provide some support as well, although we are stil above 5.2%.

Intraday update: The bid in oil is helping SPX/ES hold up, but obviously hurting NDX/QQQQ/NQ. Speaking if NQ, watch critical support at 1560 and as discussed previously, the gaps below that. The SOX has taken a beating even with the strong opening bid for Intel. The Nasdaq Advance decline line is only -14 so far, whereas TRINNQ is in sell mode at 1.75. This tells us selling is concentrated in a few big issues, but the overall trend is still more chop.
The TRAN (Transportation index) (chart) is on a very bullish course with 5 dma support holding up for the past six sessions. Keep an eye on that level currently at 4766.

Monday, June 26, 2006
QQQQ threads the needle and manages a close at exact May lows. There really is nothing going on other than chop. Buy support, sell resistance with a slight bullish bias. The one piece of relevant news is oil closing strongly above the 20 day moving average after an early dip. Look for that support going forward (71.15). The bear flag is negated and it is now buy the dips for QM/CL above 20 dma.


Speaking of VXN (Nasdaq Volatility index), notice how we are bumping against 10 day ema and starting to trade on a regular basis in the lower part of the enevelope. This is normally bullish, but keep on eye on the mid-point.


Intraday update: NQ weekly R1 is 1595.25, right above a potential breakout of the current triangle at 1590/1593. Watch that line and a possible formation of an uptrend channel. Of course, a strong failure at 1590/1595, would postpone that event. Support is firming up at a rather steep upward trendline, currently 1566. Note the possible 20 dma stumbling zone at 1580. A break below 1560 (61.8%) undoubtedly sets up an attack of the June gap below and as mentioned earlier, weekly S1 at 1551.25.
For now, TRINNQ is mildly supportive of this bounce, but VXN is not turning red yet, so caution is warranted.

Sunday, June 25, 2006

Once again, overnight QM/CL (oil futures) seems to be faltering at 20 dma, 71.15, in which case the bullish scenario is negated. 70.50 is a must hold now for oil bulls, or the recent bounce was just another bear flag on the way down to 65. That does not mean I suggest shorting it, in fact I am not comfortable with that idea especially above 70.40/70.50. Wait for a break below. If you are long, your stop should not be lower than 70.35. Resistance is clear at 20 day moving average (71.15) and further up at 50 dma 72.50.


We are stuck in a range ahead of the Feds. QQQQ (see daily chart)could not hold the May lows at 38.23 on Friday and it could set up a move down to the June gap 37.63 / 37.84. I don't think we will take out the yearly lows ahead of the Feds. In fact, I would be a strong buyer of any drop to the 37.70 area.
Futures traders should focus on NQ ( see 60 mn chart) and its gap at 1545.50/1556.75. We usually get a test of either weekly S1 or weekly R1 early on, and since weekly S1 is at 1551.25, it puts us right in that gap. I would buy any drop that stays above 1545.50, but start hitting it at 1550 or so. Weekly R1 is 1595 and a possible short, but only if the gap has not been closed or weekly S1 tested. Bullish scenario has 61.8% of rally hold at 1560, also a double bottom, in which case buy it ahead of the Feds and possibly get a cushion. Keep in mind we have end of quarter window dressing, and one might want to fish for bargains that are being unjustly punished. Add the Feds, and you have a recipe for some pretty serious volatility.

Friday, June 23, 2006
Pretty lame close. Not a catastrophy, but not quite good enough. We have gaps below for ES and NQ that are like magnets and if NQ can't hold 1560 next week, we will hit 1545/1550 very quickly and possibly firm up a better base. But 1560 is still holding, so we wait and see.

Intraday update: nice turnaround as bulls hold on to NQ 1560 and ES 1250. Financials are lower as is the SOX, so this rally could find resistance soon. Nevertheless, more evidence a medium term bottom is in. COMP is back above the 10 day ema and now needs to break down the 20 dma wall at 2144. The bulls need to close the week above QQQQ 38.23.


The key development for the markest this week is the move above 5.2% for the Ten year. The TNX chart looks headed for 53.90 eventually, helped by a very hawkish Fed intent on torpedoing the economy, not just slowing it down.
Keep an eye on NQ today and the 1560 level. Very critical, as we have quite a large gap below. If it holds, bulls win a major victory in the retracement wars. The ES equivalent is 1250.

Thursday, June 22, 2006
Levkovich interview. He's bullish, but not on energy and gold.
Link

Oil has bounced back above the 10 day ema. If that levels holds (70.50) we could get back up to 75 soon, but keep an eye on 20 dma at 71.20. If we fail here, it will just be another bear flag on the way down to 65.
But have no fear, oil bulls, if it is not Iran, maybe it will be Global Warming and more storms:

WASHINGTON - The Earth is running a slight fever from greenhouse gases, after enjoying relatively stable temperatures for 2,000 years. The National Academy of Sciences, after reconstructing global average surface temperatures for the past two millennia, said Thursday the data are "additional supporting evidence ... that human activities are responsible for much of the recent warming."
Other new research showed that global warming produced about half of the extra hurricane-fueled warmth in the North Atlantic in 2005, and natural cycles were a minor factor, according to Kevin Trenberth and Dennis Shea of the National Center for Atmospheric Research, a research lab sponsored by the National Science Foundation and universities.
Link


Intraday update 2: ES holds the trendline and 1257.75 is a key number now above that. Note the ascending triangle (60 mn chart), which is normally supportive. Not many catalysts out there to get a reversal, so be careful. The ten year note has hit the May highs and that is a red flag.


Intraday update: setback for the bulls, just to remind us that bears still rule. Watch QQQQ 38.23, May 24th low and must hold. The 20 dma is at 38.52 and bulls would like it back. It seems all that call resistance at 39 strike hurting momentum, but I do notice a pick up in puts at the 40 strike. Max pain is setting up to be at 39.
Link

Wednesday, June 21, 2006

Today was an important day for bulls. They managed to close QQQQ/NDX/NQ, the SOX and the DOW above their respective 20 day moving averages. ES/SPX still below that level as is the COMP, but usually, NQ shows the way and it seems it is up. Now before we get too excited, note that many calls have been piling on to the QQQQ July 39 strike, which could build up some resistance as we get closer to July option expiration. Short term, this is bullish as more traders jump in long the market, but it could stall us starting from the second week of July. Just keep this in the back of your mind and don't be afraid to book profits. Nevertheless, a good day for bulls which just shows you how much can be accomplished when the Feds keep their mouth shut, even for a day.


Intraday update: summer rally is under way. Watch NQ/QQQQ/NDX. Here is a chart of NQ. Watch that 20 day moving average. A close above would be a big shift (1588).

Tuesday, June 20, 2006

Let's take a look at Gold. Using a fib projection from May H/L, we can clearly see the support and resistance levels. The June 14th low of 547.20 almost hit 100% at 544.70. Since we seem to have resistance at 582, 61.8%, that will be the gauge as to whether or not we have put in the lows. Should we fail here, I would think 544 would be right around the corner. The best play at this point would be to wait for a break above 581 that holds. I would be very careful if we fall below 558, 200 dma.
The backrop is very simple: higher rates, especially ones that take us past neutral, are bullish for the dollar short-term and a graveyard for gold as inflation becomes a non-issue. Flight to safety is no longer a gold play, it has been supplanted by attractive yields. Further out, there is a danger of stagflation as the Feds go too far and keep raising rates in a slowing economy. That is the nightmare scenario for the Global markets and the inverted yield curve is looking very ominous. The hope is that for all their tough talk, the Feds might call it quits at 5.25%, and that could give gold a floor. I certainly hope so, because I am not sure the markets have fully priced in any hikes past June. Conclusion? Range bound trading for everyone ahead of the Feds.

It seems we are stuck in a tight range as we get closer to Fed day. Not much to say other than QQQQ has put support starting at 38 and call resistance at 39. End of quarter window dressing should kick in soon, let's see what that will be about.

Monday, June 19, 2006


ES and NQ have pretty sizeable gaps below should 5 day moving average support break. For ES it is 1241.25/1245.25 and for NQ 1545.50/1556.75. Absolute last line of defense, or we will see new yearly lows. As profiled earlier, a breakdown would start with the loss of 61.8% at 1560 for NQ. 1548.50 is 76.4% and right in the middle of that gap, so it could be a target should we lose 1560. QQQQ has solid put support at 38, but these days, that has not counted for much as volatility sellers up prices expecting the worse.


NQ (NDX e-mini futures) bounced off 61.8% recent rally. Must hold at 1560.

This says it all:

June 20 (Bloomberg) ... Merrill Lynch economists speculated in a June 16 report that Fed's likely decision to raise interest rates shows that Chairman Ben Bernanke is willing to risk harming the economy to shore up his credibility as an inflation fighter. Bernanke and other central bankers are paying more attention to their reputations among investors than to economic fundamentals, and in fact an economic slowdown in the U.S. has already begun, the report said.

Link


Another look at the monthly chart of TNX (Ten year note)shows that after bouncing this month off 50% 2000/2003 at 49.485, we look headed for a retest of August 2001 and May 2006 highs (51.93). If we move past that, next stop would be 61.8% at 53.91, or 5.9% on the ten year note. This would be very bad news for the equity markets, so keep an eye on this development.

Sunday, June 18, 2006

For oil, the road back to the 2006 highs is being thwarted by a series of bear flags and for the past three trading sessions, clear rejection at 10 day ema (now at 70.10). Important for oil bulls to get back above that moving average or else we will see a quick retest of May low at 68.40. Trendline support off February is currently around 67.60. Failure of both those levels sets up 50% May projection at 64.45. It's tempting to jump in now, but be patient and wait for a daily candle close above 10 day ema. CL/QM and commodities in general are very momentum friendly. Once it goes, it goes. No need to take risks.


ES (SPX e-mini futures) could be in the process of building a base above May 24 lows (1257.50). Watch that and its 10 day ema at 1260.75.

Many bring up the crash of 1987 when looking at the current action. If we are headed for such a scenario, remember that the SPX 1987 highs were registered in late August, after a warning salvo 7% correction from April into May. Then the sickening 30% drop all the way into December. I don't like to use past calendars as reference points, but a summer rally, should it occur and I think it will, might be a chance to get out and let the dust settle.

Friday, June 16, 2006

The first order of business for bulls next week will be to crack 459 on the SOX which was 11/17/05 support low before a strong gap up move and current 20 dma right below at 458.

NEW YORK (Reuters) - The Federal Reserve will likely end its two-year credit tightening cycle at the end of June when it raises interest rates to 5.25 percent, an influential New York-based think tank said on Friday. Fed policy-makers, like their counterparts at the Bank of Japan and the European Central Bank, are very sensitive about increasing rates while economic growth is slowing, but recent inflation data has forced them to tighten a little more than they had planned, the think tank said in a presentation to analysts.

"The Fed will hike rates at the June meeting up to 5.25 percent, and they will keep the 'vigilant' language open even while they are softening the economic outlook," said a member of the firm, which meets regularly with Fed officials.

Link

QQQQ, NDX, SPX, as well as ES and NQ need to hold on to May 24th lows at the close. QQQQ 38.23, ES 1257.50 and NQ 1577.50. If bulls manage that, the rally is still alive.

Thursday, June 15, 2006

Watch the NYSE and 7900 level in the next few days. 200 dma at 7917 and 2003 regained trendline at 7900.


Everyone behaved, including Bernanke, and the bulls get the ball back as we cruise above 10 day ema on all major equity indices. Resistance is pretty obvious at 20 day moving average for QQQQ. SPX has confluence 20 dma and 200 dma right at 1260/1261 and that is going to be the big test going forward. Add March 2003 ex-trendline support now at 1265, and you can see where the bears will mount an attack.

Wednesday, June 14, 2006

NQ weekly S1 held all day and the bullish advance decline volume, reflected in a low TRINNQ (below .50 most of the day) set up the stage for a closing rally. However, the actual advance/decline line was relatively weak, indicating that strength was concentrated in a few key stocks. I'm also noting a flip of the QQQQ 38 strike from above 1 put to call ratio to below 1, which means call resistance is building at 38. Since it is also home to the 10 day ema, expect that zone to be resistance this week. But if bulls can hold on to 37.49, we might have seen a solid short term bottom.
SPX also managed to stay above the 20 month moving average (1227.25), a very important support level for the entire 2003 bull market. The month of June must close above, or the bull market is indeed over.
Link

Tuesday, June 13, 2006
Overnight, keep an eye on NQ 1530.25, weekly S1.

This article from MarketWatch, is a very good explanation as to the inherent problems of relying on the core CPI as opposed to the core PCE, which won't be released until June 29th. The PCE (Personal consumption Expenditure index)is a more up to date inflation reader as it computes housing costs differently. I any case, even though tomorrow's CPI reading will be market moving short term, it will not act as decisively for the Feds as one may think.

...." During the heady days of the housing boom, more people wanted to buy a home in order to cash in on the big gains. Condos were converted from rentals to owner-occupied. Home construction boomed and rental vacancy rates soared, keeping rents down even as housing prices were rising at double-digit rates.
But now, more people find themselves priced out of the market, or are hesitant to pay the asking prices. Vacancies are falling and rents are going up.
So, even though home price appreciation is now slowing, it's finally showing up in the CPI, years late.
The impact on the CPI has been to understate the inflation in housing during the boom, and to overstate inflation during the correction.

Apparel prices and equivalent rents could have a major impact on the CPI, but might not sway Fed officials. They understand the statistical problems with the CPI, which is one reason why they seem to prefer a different gauge of inflation known as the personal consumption expenditure price index, which treats housing costs differently.
The core PCE index has been slightly better behaved than the core CPI. It's risen 2.1% in the past year, compared with 2.3% for the core CPI. Yet another gauge that's gaining adherents who say it's more accurate -- the market-based PCE index -- has risen just 1.8% in the past year.
Unfortunately, the PCE price indexes for May won't be released until June 30, the day after the Fed's meeting.
"To the extent a pickup in core prices mainly reflects higher rents, and the pickup in rents is a byproduct of the sharp weakening in home sales recently, we believe the implications for monetary policy are less straightforward than a broad-based pickup," said Sam Coffin, an economist for UBS. "Sharp weakening in home sales and prices, if sustained, would likely lead to a significant slowing in growth, shifting the risks on inflation to the downside again."
Link


Possible completion of NDX head and shoulder projection low at 1510/1515, with a bullish divergence. QQQQ has a slightly lower target at 37.10, but we are close. I say possible, because bulls have been fooled before. But it is really starting to look a little overdone on the short side.

Monday, June 12, 2006

The bears were at it again today, unrelenting. The conditions are so oversold, they will need very bad news indeed tomorrow and Wednesday with both PPI and CPI on deck. Any in line number or better will set up a rally.
All levels of support were broken, including 200 dma for NYSE and the DOW. The COMP (chart) just about closed its November gap in the last minutes of trading and bulls are hoping that will stop the bleeding. QQQQ October low is 37.33, today's low was 37.39. NDX/QQQQ weekly RSI reading is the lowest since October 2002. One could test the long side on an overnight hit of NQ weekly S1 at 1530 or so, but any such attempt must be accompanied with a very tight stop. Don't forget this is option expiration week and quadruple witching at that, so there will be some wild swings.

Intraday update: COMP November gap close is 2090, should we lose 2105. Watch NQ 1530, weekly S1 on a collapse. PPI and CPI still due so bears are pricing in the worse.


The NASDAQ chart is gettng interesting. As you can see, I put a projection off Januray H/L which gave us 61.8% at 2105, Thursday's lows. 38.2% is at 2135, right where we closed Friday. 50% is at 2118 and I would use extreme caution if that level is breached.
If I were to short anything right now it would be the DOW (YM). Historically, the NASDAQ has outperformed the DOW over time in a rising rate environment, especially above the mean (5%) for the Ten year note. Looking at the charts, the Nasdaq seems to hug the 10 day ema a little closer than the DOW and is actually on the verge of curving up. Also note the spread between the 10 day and 20 day moving average. Definitely getting more bearish for the DOW. I am just not sure it is wise to short anything on a short term basis as long as Thursday's lows hold. But if you want to short a rally, short the DOW. If the markets keep falling it is because of rates, and higher rates will hurt DOW stocks more than anything. Remember how they scrambled to add tech stocks to the DOW in the late 90's? Guess what: rates were above 5%. And when rates dropped into the recession of 2001, the NASDAQ lost almost 80%, far more than what the DOW gave up.

Sunday, June 11, 2006


Scanning the media, not a very positive tone out there. A "concensus" that the lows are not in and any rally will not last, etc...I don't have those answers, but should we get a rally and keep on having naysayers, bulls have some hope. Aside from NYSE, the DOW (chart) is the only major above the 200 dma. Must hold (10875). ES (SPX e-mini futures) needs to hold 50% of the current bounce off Thursday low at 1260 ( see 15mn chart September contract). The same zone for NQ is 1569.25.

Friday, June 09, 2006
TXN not getting any respect and I would use caution for the next few days. Lots of calls just piled on to the QQQQ June 39 strike, not a very good sign, but also some weak hands exiting on the first bounce. Be incremental in your approach. A more sustainable rally will probably occur after June 15th. For now, stay long if QQQQ holds on to 38.23 and SOX 441. We should get a push to 20 dma at 39.13. VXN is negative and that should provide support today.
NQ (September contract) long from 1552 was exited at 1588 for +36 on the monitor ($720 per contract) and re-entered at 1569.50, right at pivot and 50%. Bullish if that holds.

Thursday, June 08, 2006


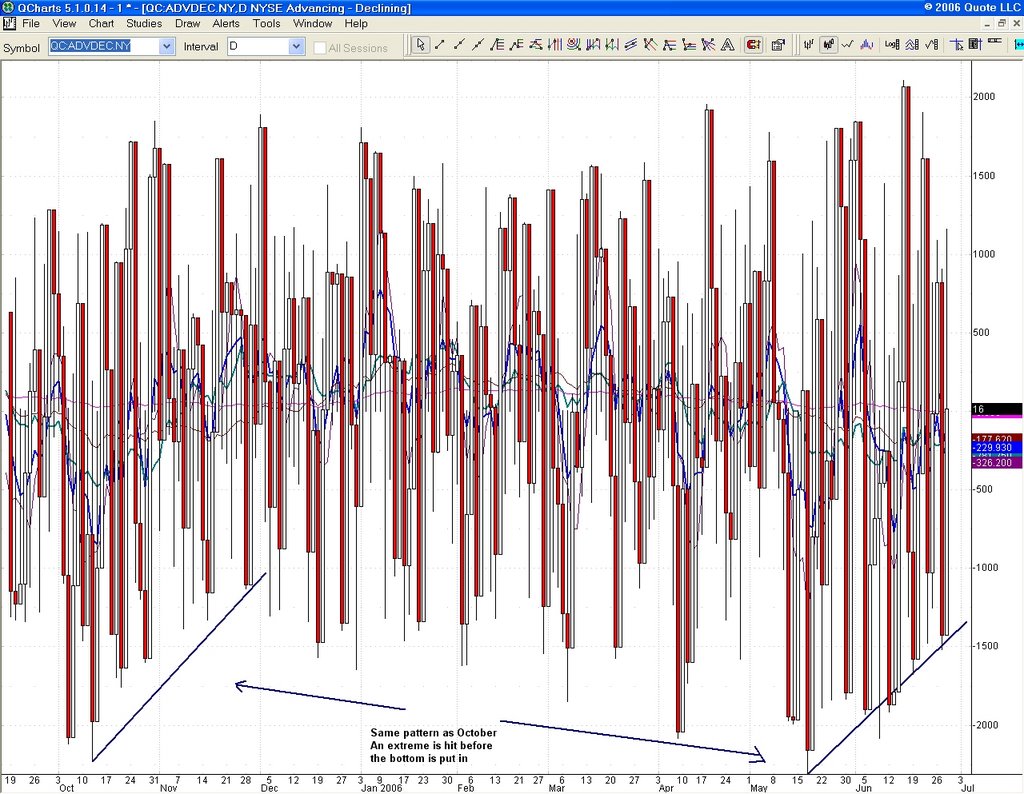
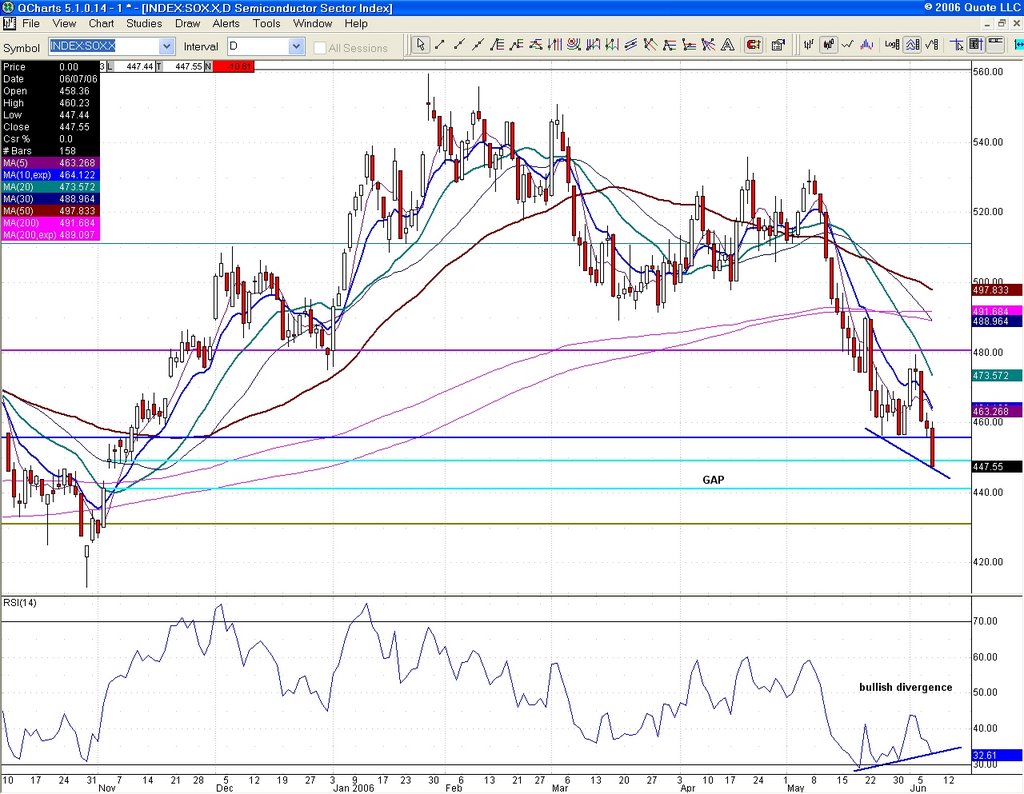
Bullish divergences at new lows on just about every single index chart out there, a roaring TRIN with an intraday high of 3.77, VIX and VXN bursting out of their envelopes, extreme advance decline readings on both NASDAQ and NYSE, 
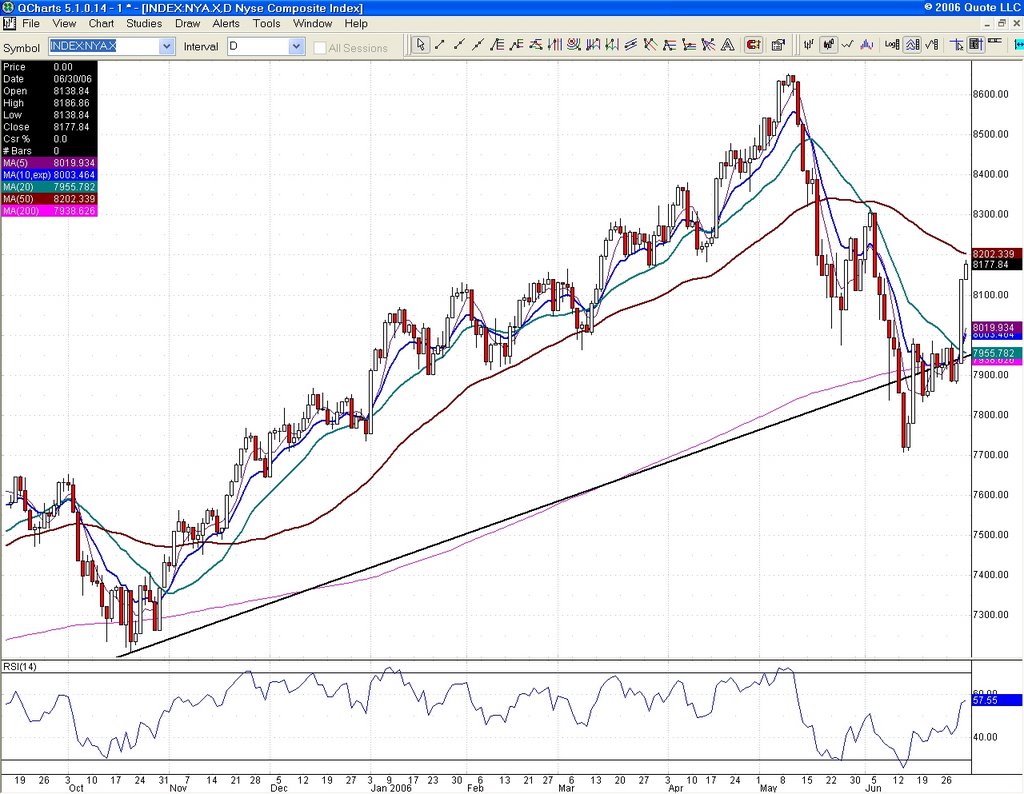
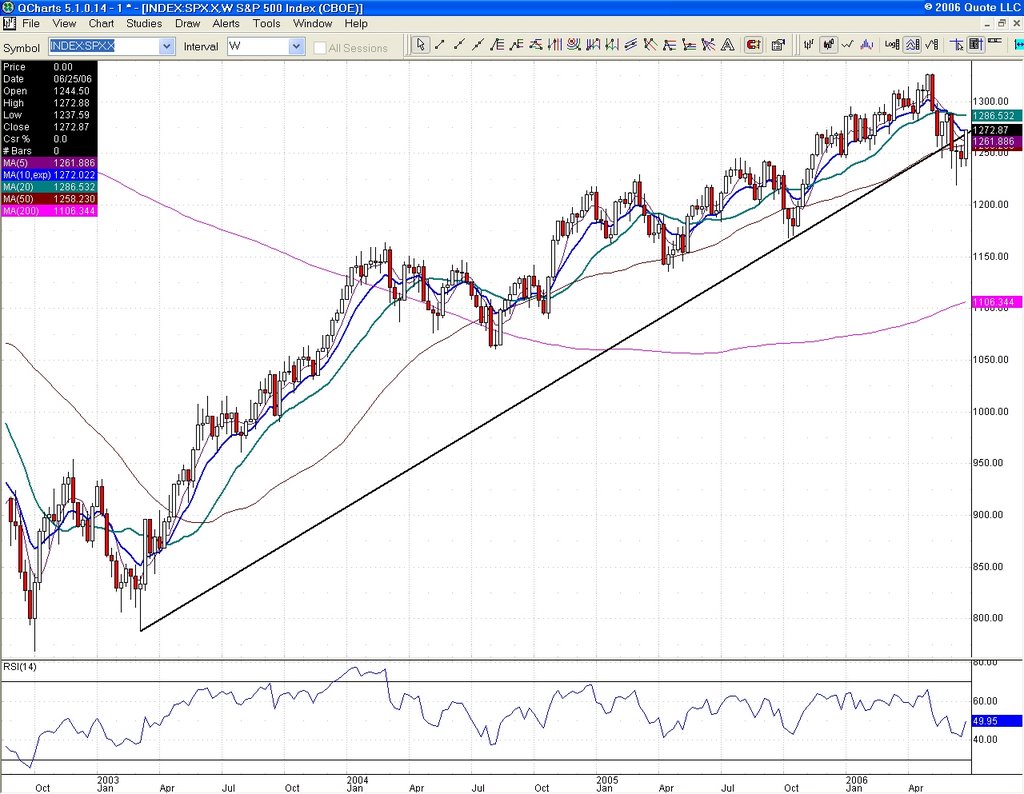
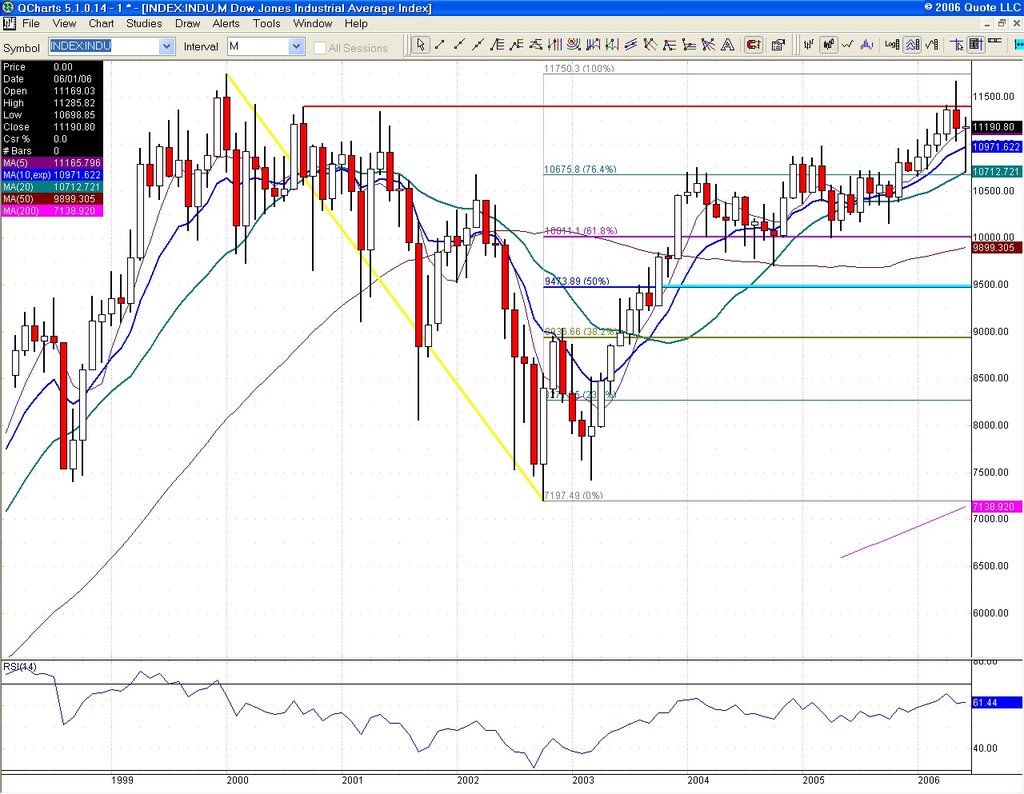
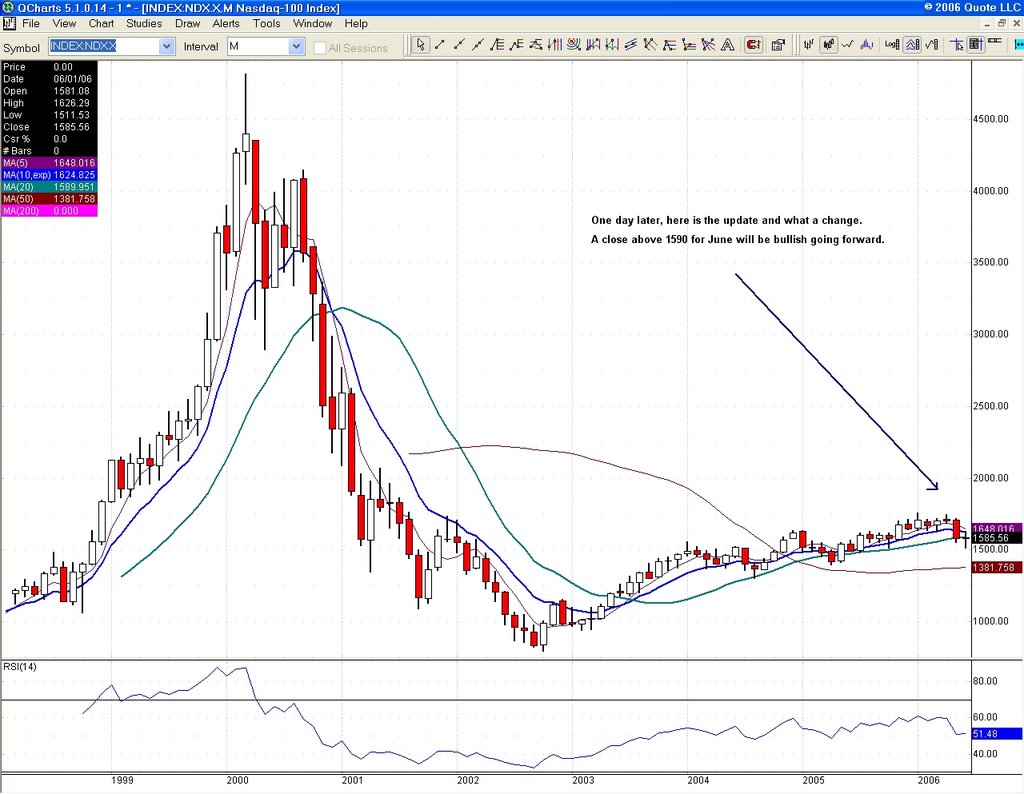
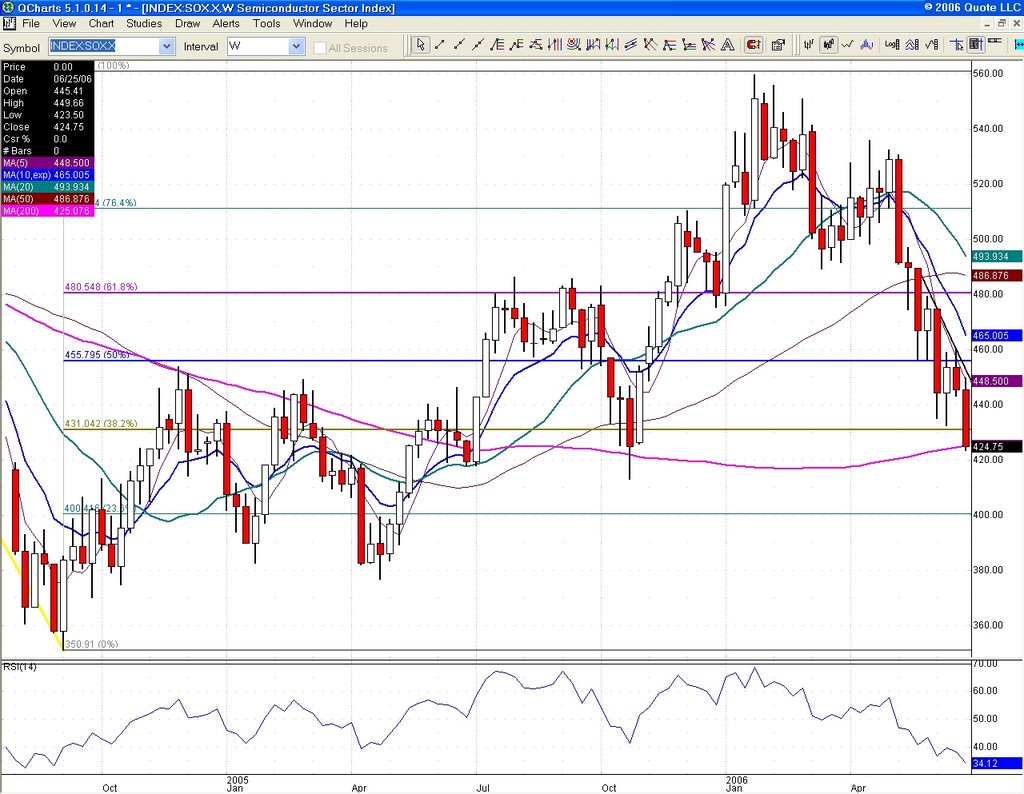
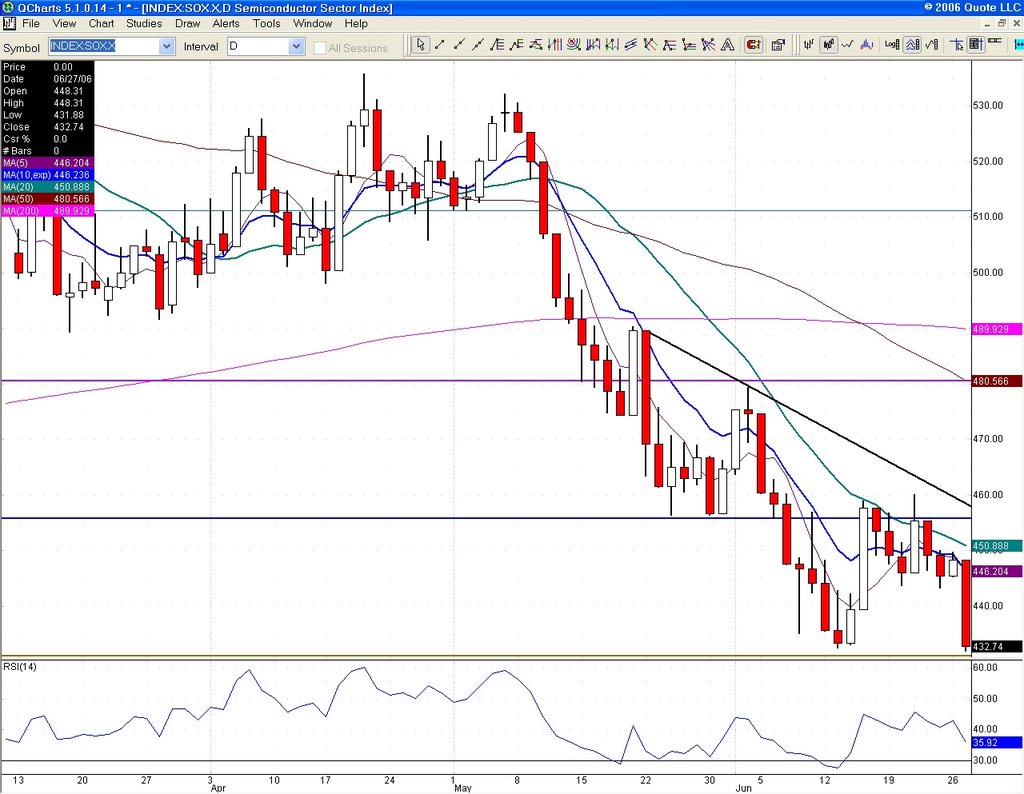
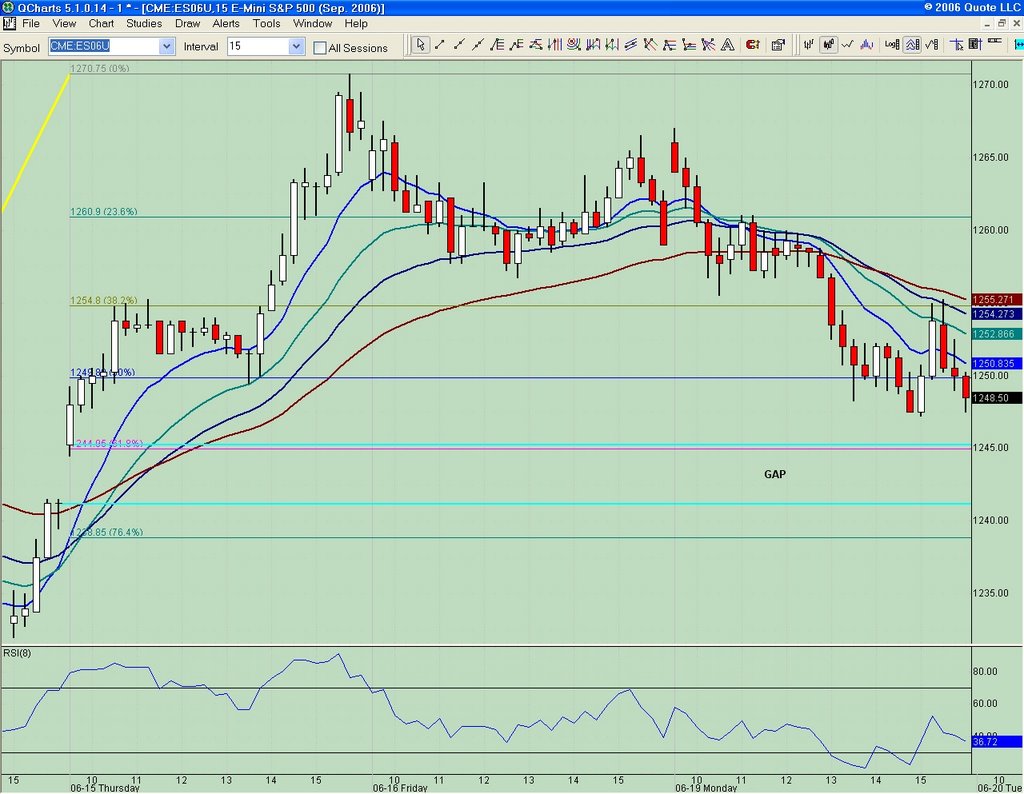
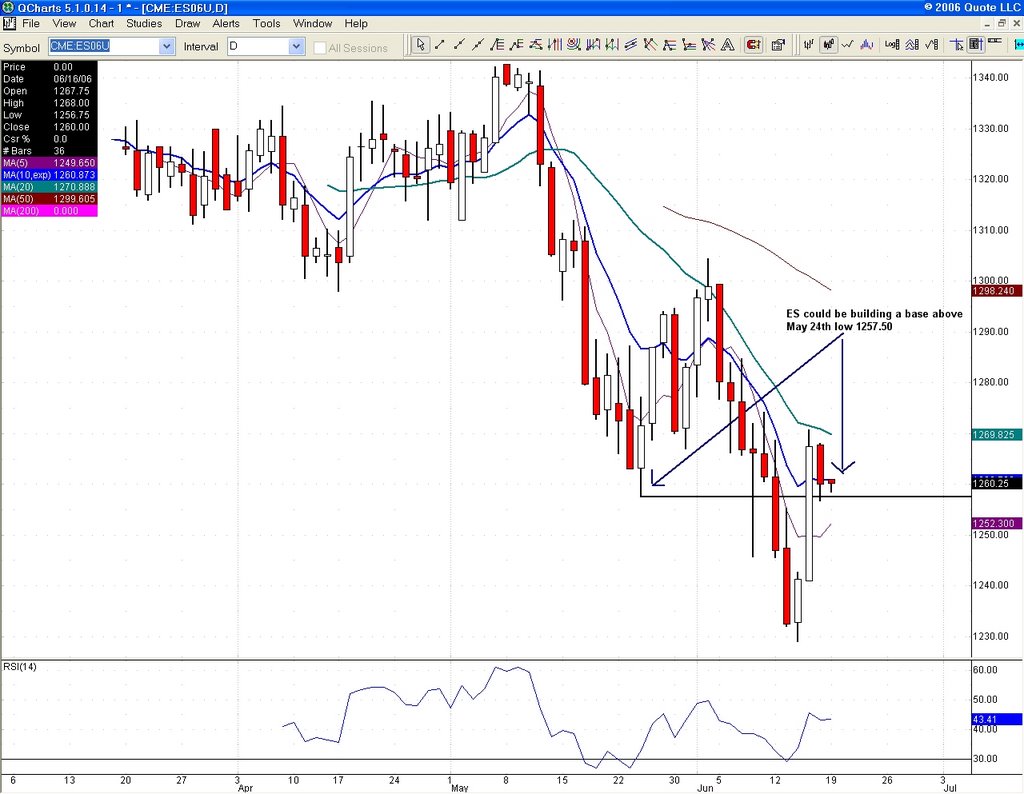
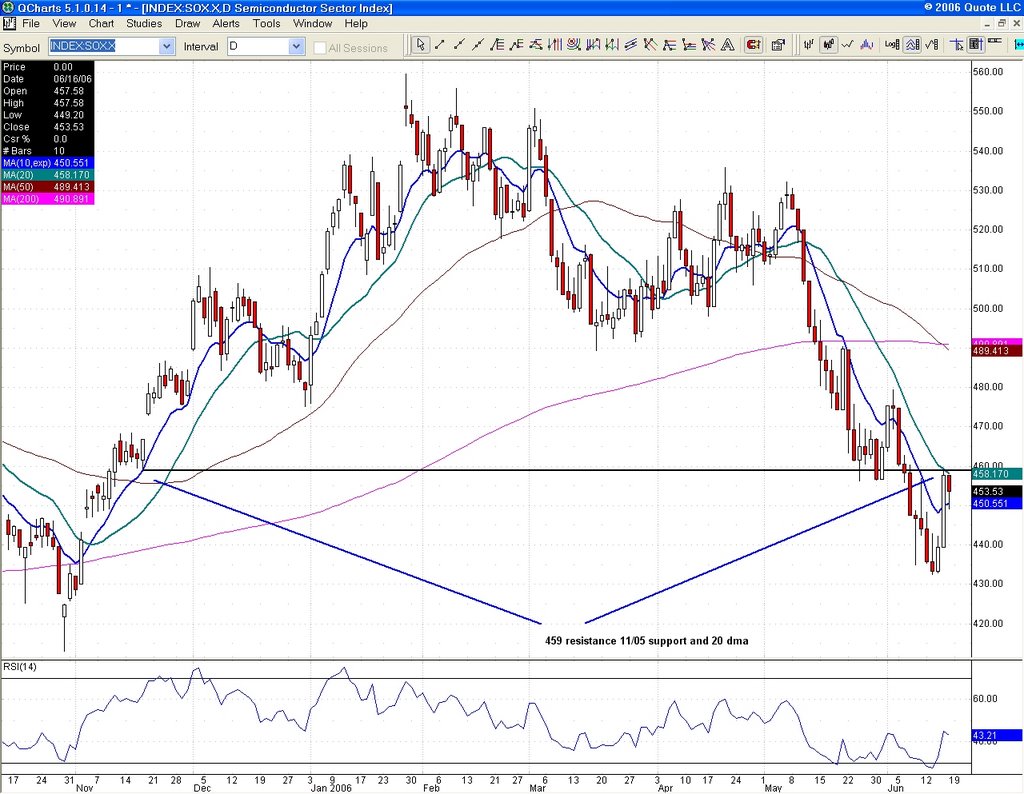
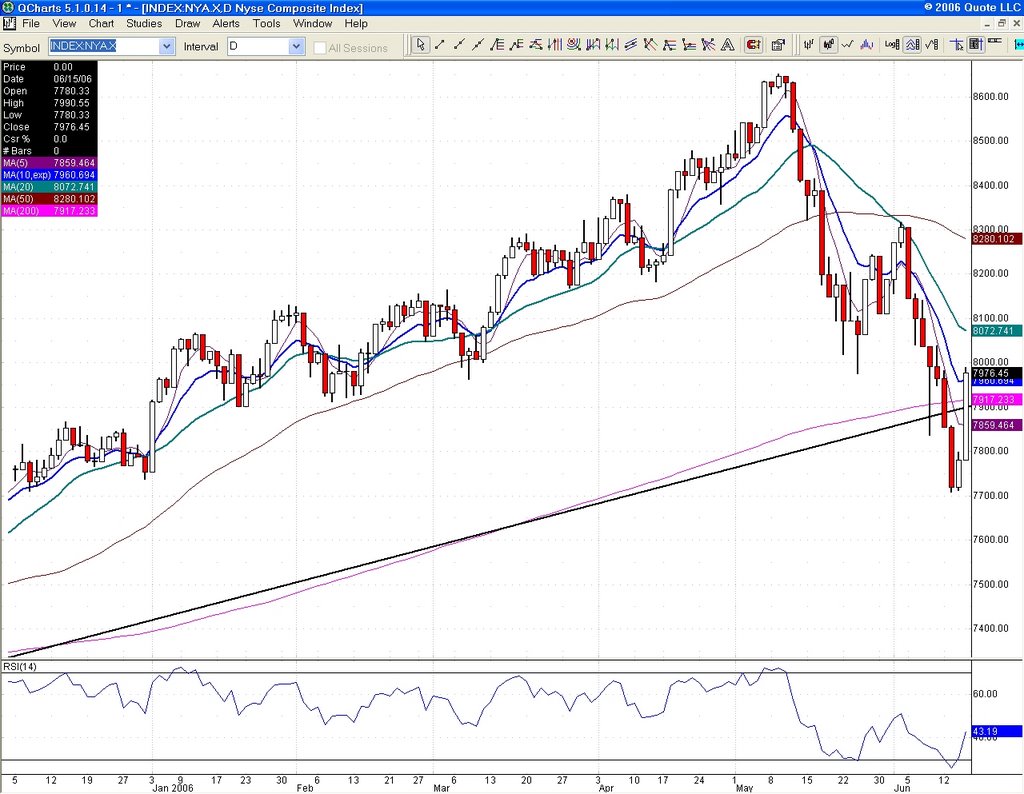
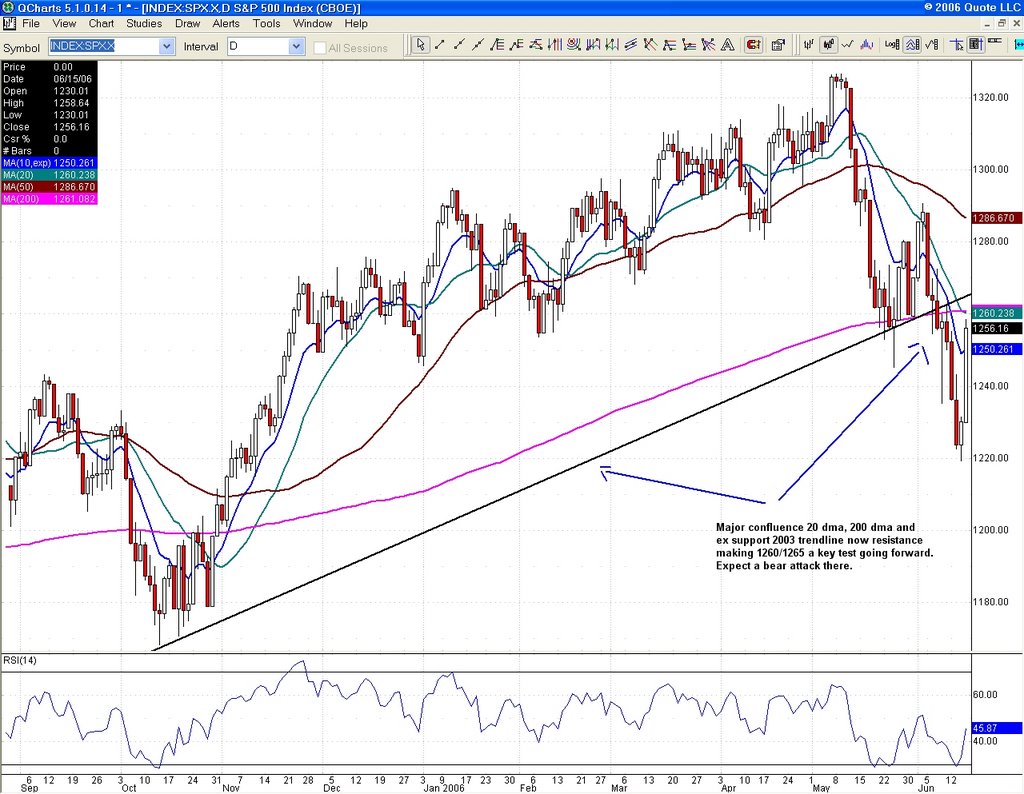
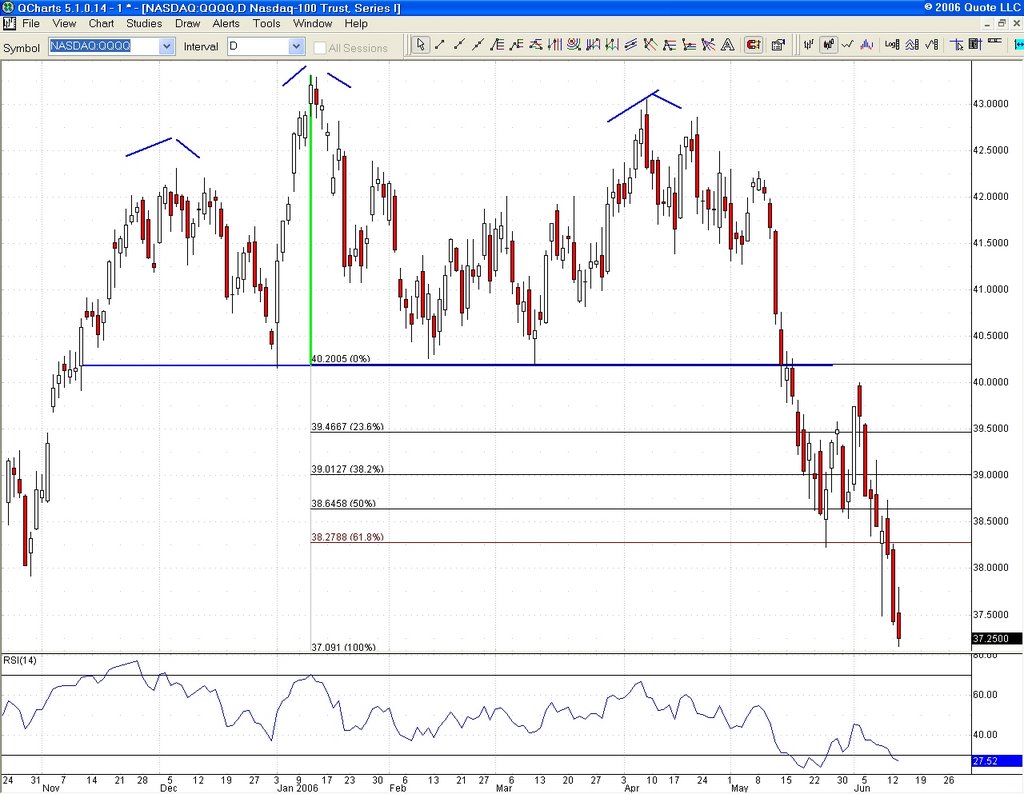
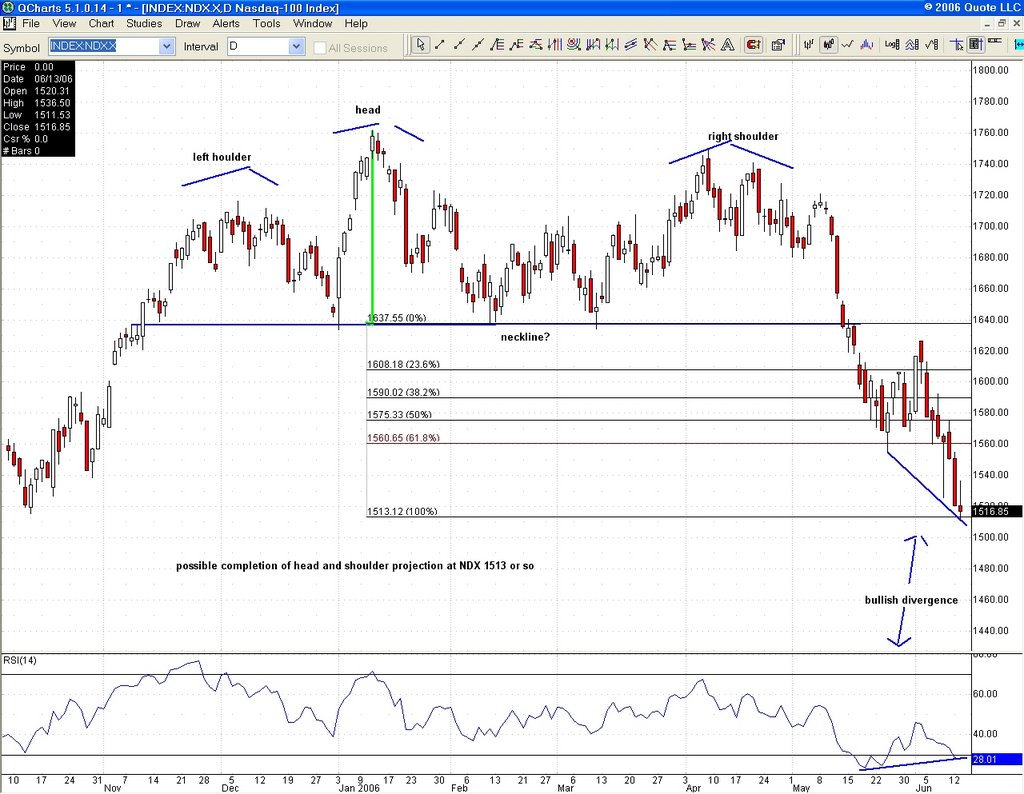
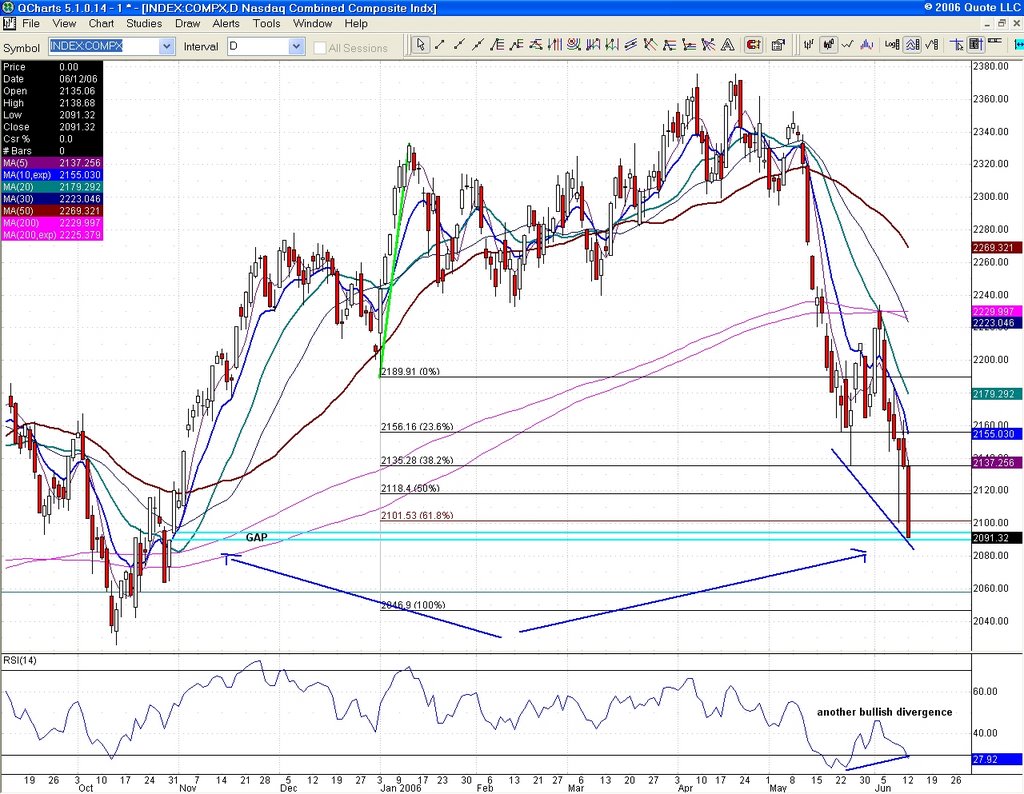
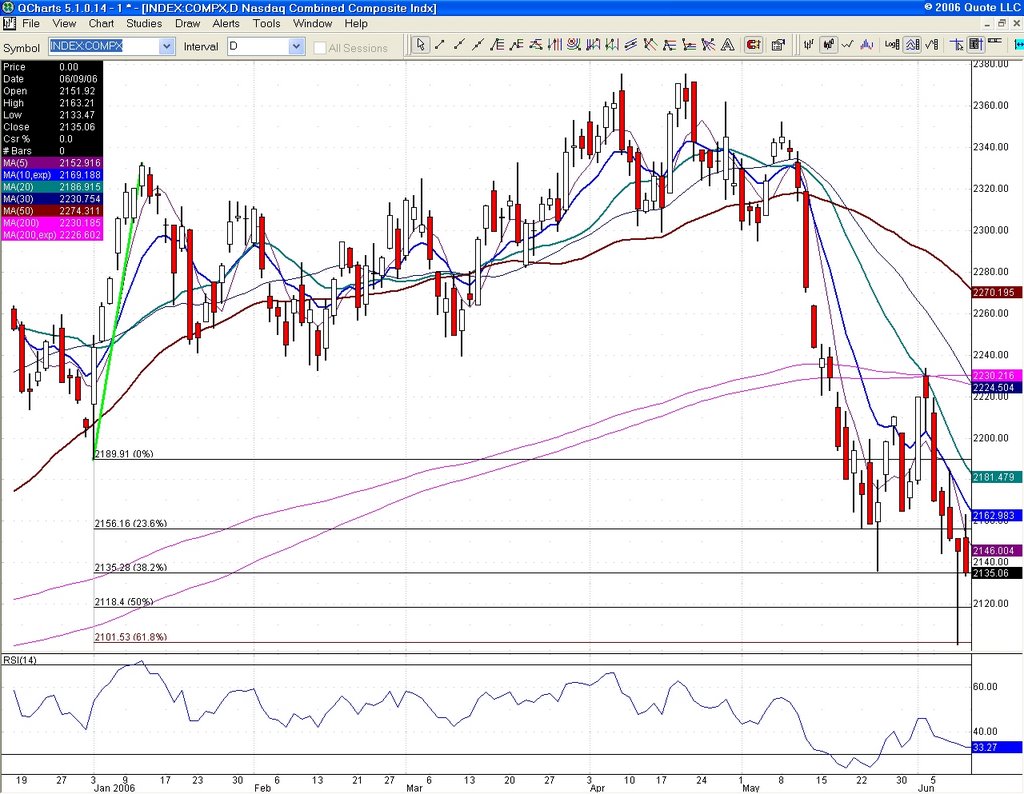
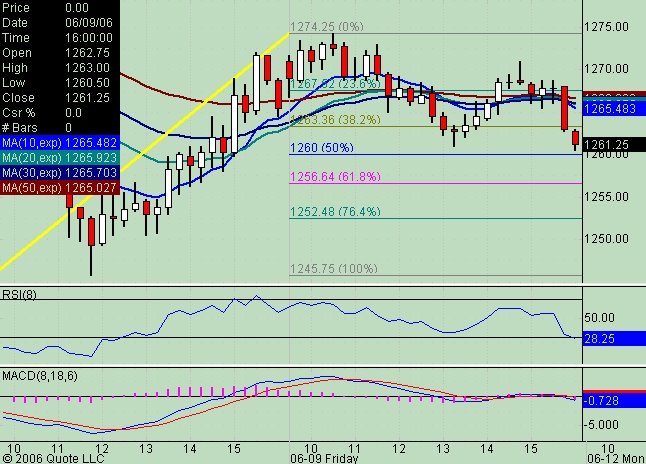
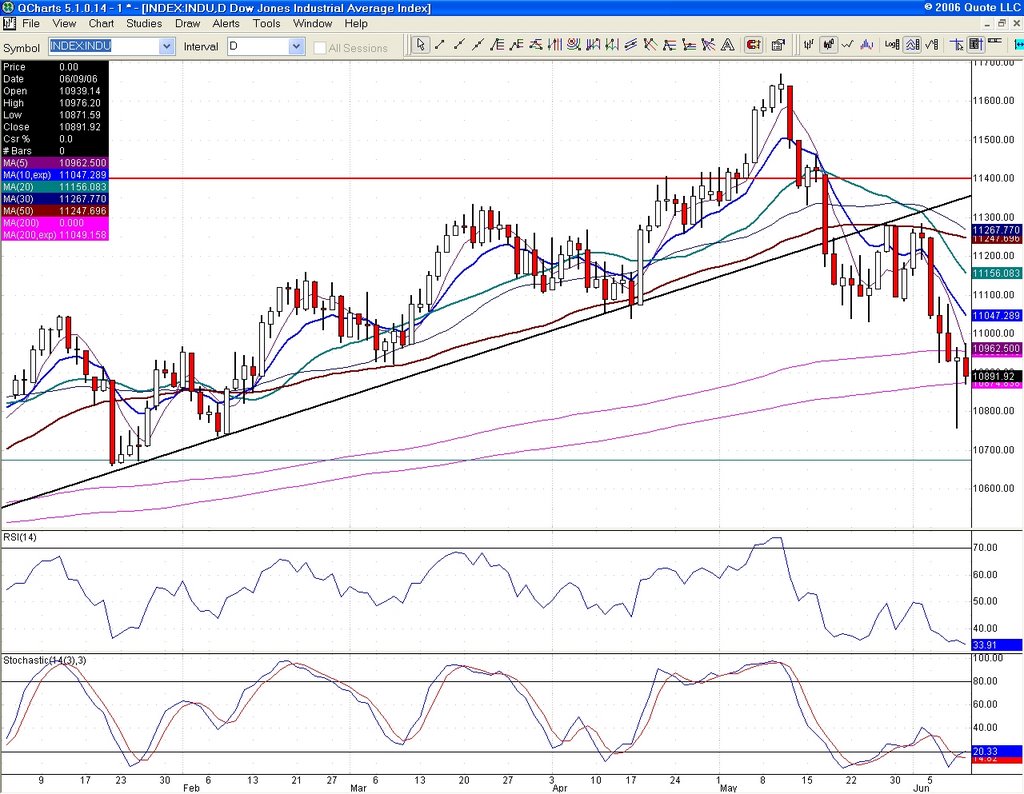
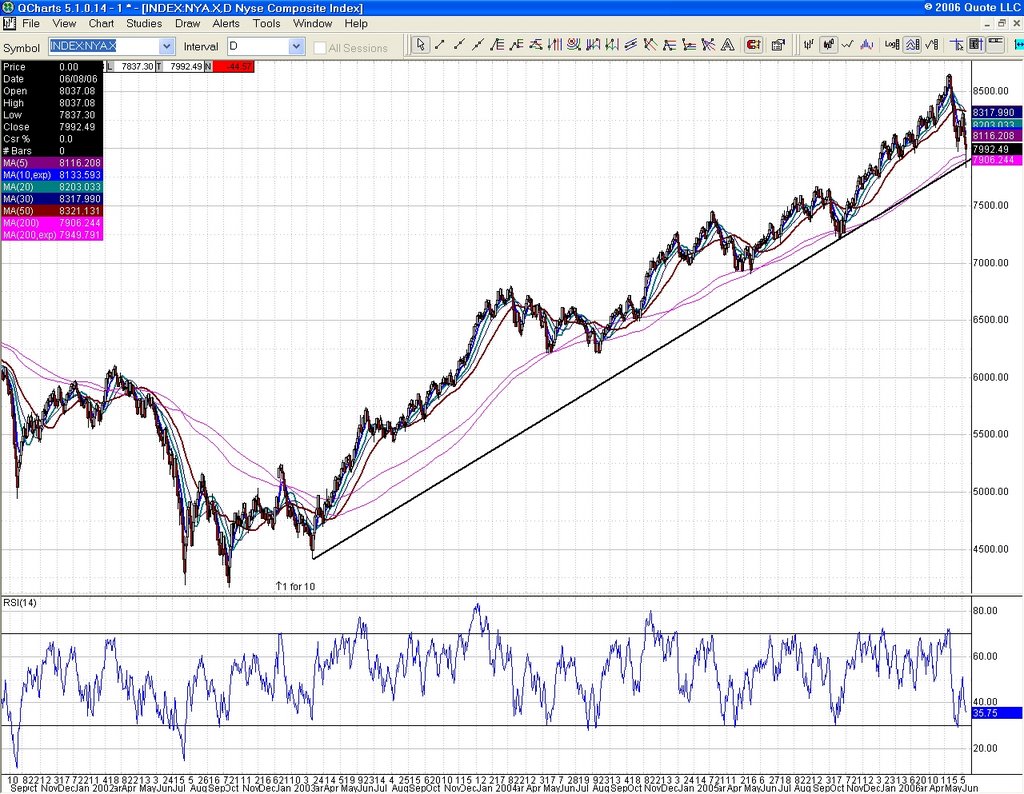
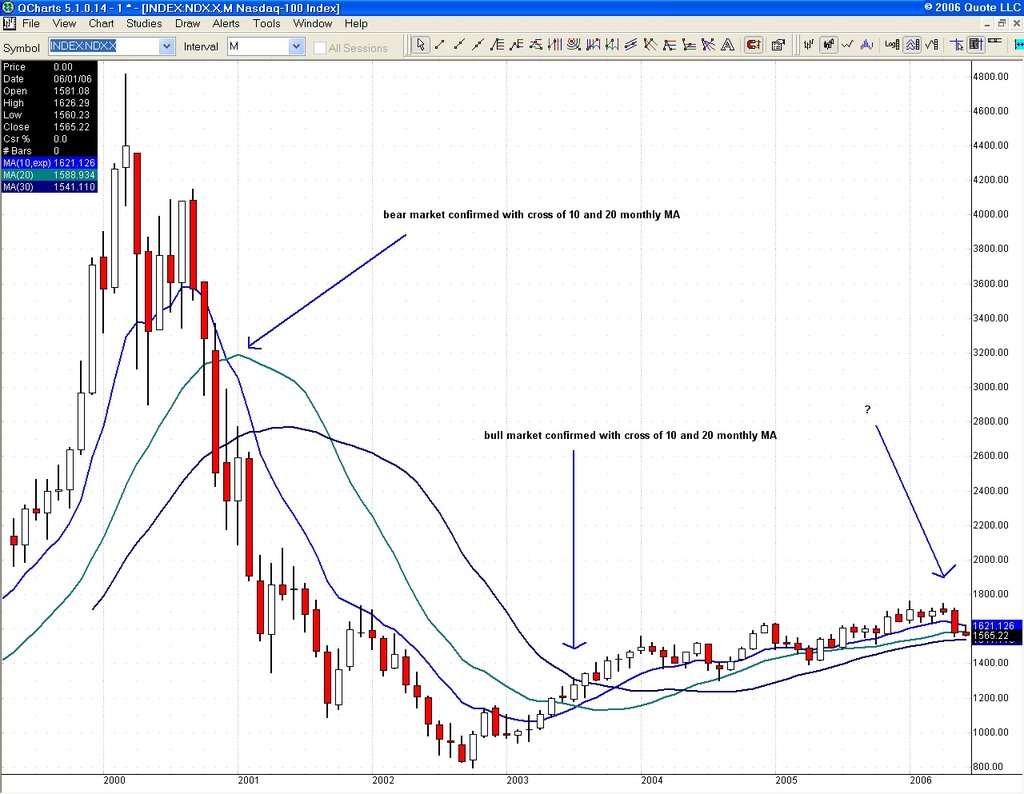
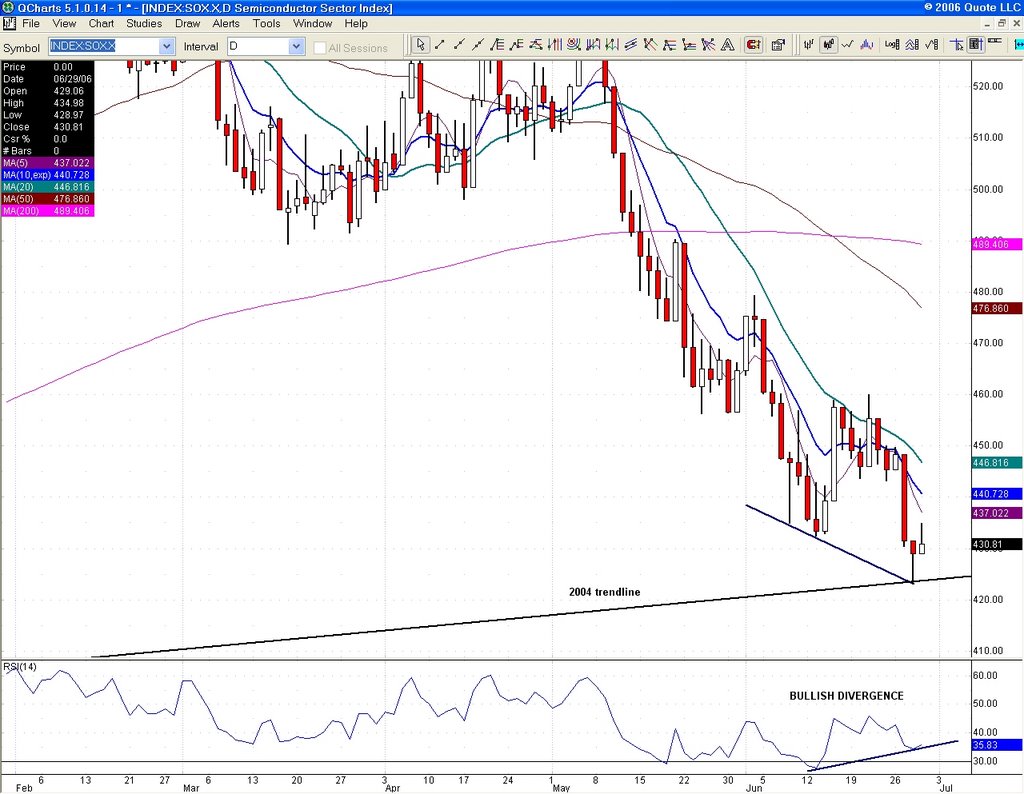
equity put to call ratio exceeding .90, the list went on and what was bound to happen did indeed happen and we experienced a bullish turnaround into the close as sellers exhausted themselves and there was no way to go but up. Ten weeks of selling and the market just said "no mas". NYSE toyed with 200 dma and 2003 trendline, COMP hit 61.8% January projection at 2105, QQQQ flirted with October lows, the SOX closed the November gap, SPX looked hopelessly lost below the 200 day moving average (still an issue), the DOW broke below 10800, NDX seemed to lose vital support at 30 month ma and just when you thought all hell was about to break loose, buyers came to the rescue. The resulting closing rally erased all the heavy losses, and some, giving us bullish hammers everywhere. Capitulation? Pretty darned close if you ask me, especially for a non-fall month. These lows should hold for some time now, barring a catastrophy and more loose lips from the Feds. Next week is option expiration week and something tells me it will not be as heavily bearish as last time, if at all. There is a serious wall of worry out there with the Fed meeting on June 29th, so expect some chop. Watch QQQQ 38.23 support (May 24 low) going forward.

Zarqawi just got killed. Oil should tumble even further at the open. NQ (NDX e-mini futures) hit a low so far of 1546, not far from the NDX 30 month moving average I discussed in the last post. This could get interesting.
Link

Wednesday, June 07, 2006

Moving out to the NDX monthly chart (use for QQQQ as well), we can see where the struggle lies for bulls. In order to keep the bull market alive, the three monthly moving averages (10, 20 and 30) must stay lined up above each other. The first step is to hold at all costs the 30 month MA at 1541. As you can see, we have not traded below that landmark since mid 2003. We could get that test as early as tomorrow. If we get in the coming weeks a bearish cross of 10 month and 20 month, you can start calling an end to the bull market of 2003.


We did get our bounce, but it did not last. Bears score a victory as the SOX loses key support at the close. It is now in the November gap which it should close tomorrow (441/442), The only consolation is that it is done with a bullish divergence on the daily chart, but lately that has not been very effective for long.
SPX closed below the 200 dma and lost March 2003 trendline support. It must now hold 1253.29 (61.8% 2000/2002) at the close or we are in danger of retesting May lows at 1245.34. We are still trying to form a bottom, but bulls need to step up to the plate quickly and with conviction. Oil is down three dollars and looks headed for the 60's again. Gold has lost its luster as inflation fears evaporate with Fed tough talk. The time will come when it will be fashionable to hype stocks again and when that happens, look out above. This is not 2000 or 2002. We are not at outrageous P/E's, in fact we are right where we want to be. Neither are we in a recession or getting near one, although Bernanke needs to lighten up. The negative noise is deafening and even though it hurts, remember that a decline with pessimism is a strong recipe for a reversal. If everyone was bullish right now, I would be very worried. Nevertheless, conservative traders should wait for an all clear, while aggressive traders should either short or nibble at longs on drops only (do not take longs on upside breakouts) and with tight stops.