Wednesday, August 31, 2005
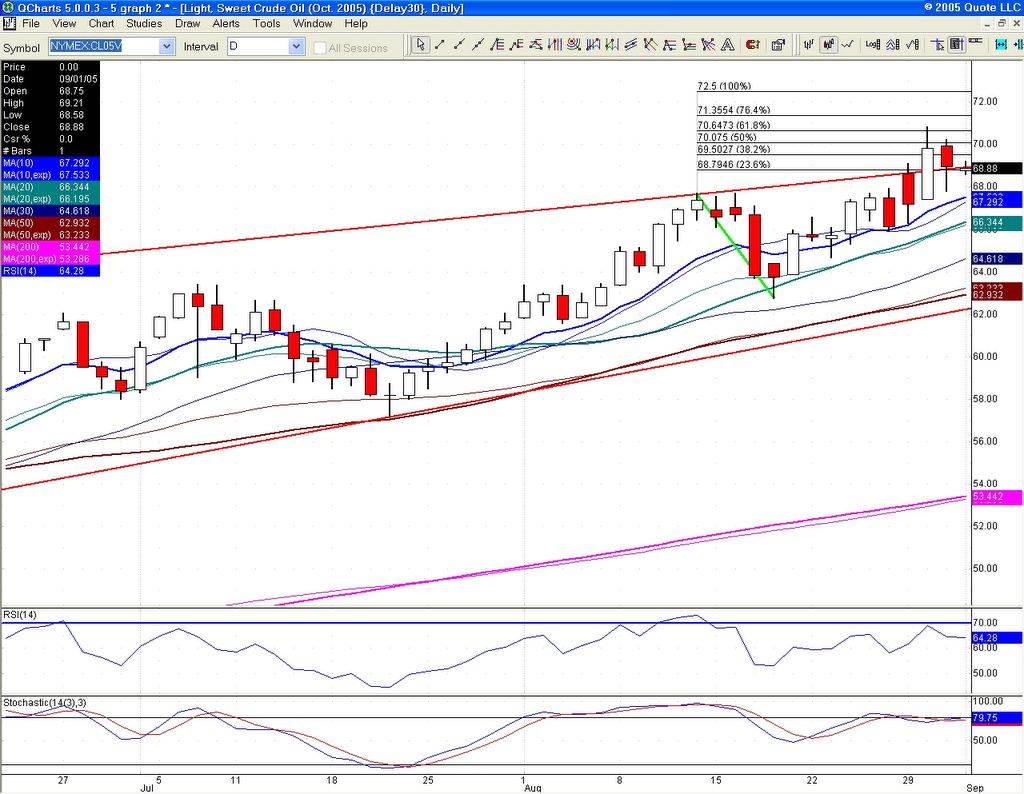
NQ (NDX futures) shows the most promise for bulls. It out of the downward channel, but still struggling at 20 dma (1586.50). Support is now 1578.50 and 1575. Bulls need a close above 1586.50 tomorrow. Everyone betting on a classic pre-holiday rally. It will depend on oil, see my previous post.

click on chart for full size
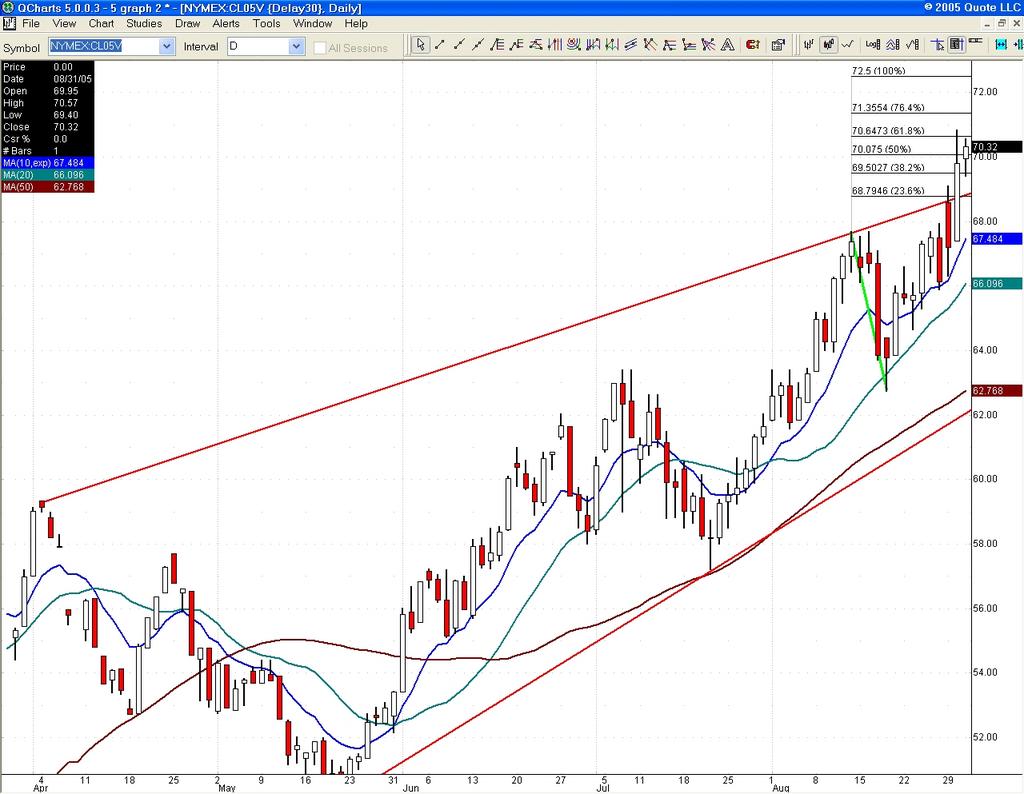
click on chart for full size
![]()
![]()