AheadoftheNews Blog

A blog on market moving news and futures trades.

Tuesday, October 31, 2006

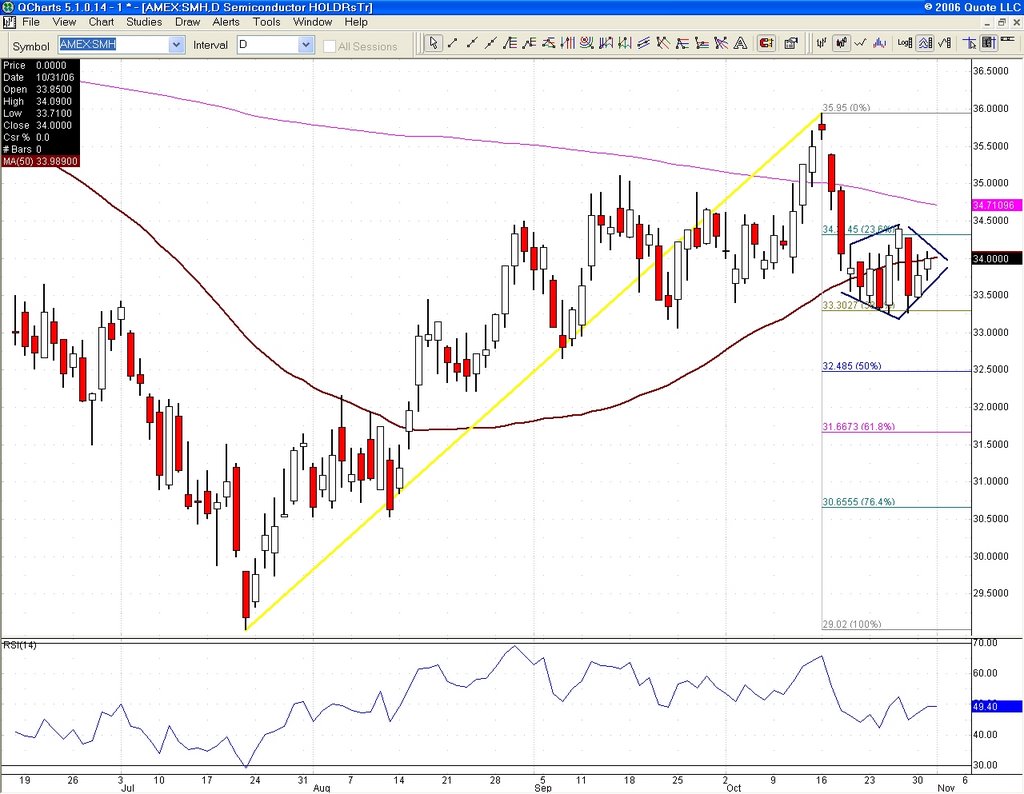
Semis are starting to feel some pressure. This chart of SMH shows the 50 day moving average battle, but also a diamond formation (lower lows/higher highs followed by higher lows/lower highs) which is normally bearish. Resistance is 34, 34.25 and 34.70. key support is 33.30. A close above 34.25 and more importantly 34.75 puts semis back in charge. This theory that we can sustain a prolonged rally without the semis, on the basis that business IT spending is in software, is somewhat dubious. It is irrelevant (was October relevant?) that we are going into November, in fact early November could be bearish. However, shorts should take note of the strong put support below us so the second half of November (going into option expiration) should be bullish. But for now, I would be patient if looking for a long entry. We could be in a short the rallies mode for a week or so. My advice is still to take this one on a day to day basis. Today's push into the close was welcome news for the bulls, but we have to see if there is some follow through now that we are done with the fund year-end shuffle.


The big event tomorrow will be oil inventories at 10:30. Today, "surprising" support was found right at 76.4% 2005/2006 after a brief pull out of the descending wedge. Support is at 58.10/58.20 and 57.50. Resistance is 58.65, 59.50 and 60. Falling wedges are bullish formations, but they can narrow the range for some time, so trade it. But one cannot ignore the strong bounce off 57 with positive divergence and the bullish hammer close.

It's an awful day to trade equities. Funds are doing their racket and direction is hard to come by. It's just amazing to see how hard they are working to prop things up for their little bonuses. The best trades were in oil and gold.

That bid in oil gave the bears some ammo. Let's see what happens at the close.

And there goes oil, now at 58.15, up more than 1 point off the lows when I made the post about the selling getting overdone.


NQ 3mn chart with fibs.

Support held up for NQ, but it's all very choppy and tied to every tick of QM. I doubt the highs will even come close to being revisited today. SOX has taken the lead, though and NQ broke out ever so slightly above trendline resistance.

That didn't last. Steady series of bear flags the past hour. Watch NQ 1731 support.

10 DMA support once again for NQ (1731). Semis are green.

Qm hits 57.025. Getting a little overdone, especially since he weather forecast only runs up to the first two weeks of November. Seeing some bullish divergences at lows, 57.20 was an area of support for the November contract, let's see if they can find support on the December one. Otherwise, it's 56.50, but two days in a row of S2's would be unusual. Nevertheless, funds are offloading today before EOM. Inventories tomorrow are expected to be bearish for oil, you just have to figure out at what point is it priced in.

Looks like COMP 2374 was the stall. This advance was done on weak internals. Just watch out for the pre-lunch bid. Oil keeps dropping, now testing the bottom of the descending wedge (more on that later).

COMP at first half 2006 highs.

Choppy, but TRINNQ was supportive of NQ, now testing 61.8% at 1743.50.

NQ closes the gap at 1736.75. SMH drops 33.82 support, let's see if all this holds up. Watch QM and the 58 level.

Keep an eye on SMH (semis) 33.82 level.

NQ drops to 50% at 1739, doesn't quite close the gap. The weak internals to start with have gone negative. ES has a must hold level at 1380/1381.

NQ leads the charge, but it remains of the light variety as ES shows little enthusiasm thanks to falling energy. Most of the SPX earnings growth the past year has been in that sector so it is no suprise. QM did not quite hit S1 and it seesm content to find support at a level the November contract briefly did.
Gold does a remarkable job of staying afloat given the QM drop but the dollar is struggling against the Euro and that is helping. The ex-trendline resistance from May, now support, was where gold found a strong footing.
Remember that this is the last day of the month and mutual fund year-end at that, so don't take too much at heart.

Gold closes the gap and tests 50 DMA at 601.50. It's a must hold here.

Monday, October 30, 2006

Last day of the month coming and NQ (NDX futures) just made a lower low and lower high on the daily. Add a bearish RSI divergence at highs last week and bulls should proceed with caution. As with ES, we could still see a test of the bottom of the channel. Some important data coming out this week, including jobs, and there could be some more distribution.


The dollar is forming a bullish ascending triangle but with a bearish divergence on the higher lows. Not very clear, but if it can get back above 85.85 resistance, shorts should be careful. It's a tough call and momentum is hard to come by either way. This is not making life easy for gold traders who are now facing falling oil prices which they must balance with an uncertain currency outlook. Inflation is still a risk, but the Feds are in no hurry to act, at least for now. Bonds are probably the best cue at this point.


Lots of air below if crude does not hold the lows and double bottom. 57.75 would be a given on a break of 58.125 and if that does not hold, 56.50 is next. Below that, a big gap from 2005 looms at 51.95/54.50. That's a long way from here and for now, let's focus on the day to day and watch for bullish divergences on any lower low followed by a bounce with volume. Resistance is 58.65, 59.25 and 59.50.


December gold closed right at neckline support. Next level below is 50 day moving average at 602.20, gap close at 601.10 and 200 day exponential moving average at 601. Resistance above is 609, 613.50, 615 and 620/622. The strength today was surprising given the drop in crude, but once we cleared that May downward trendline resistance, the short covering intensified. Chalk it up to perceived continuing dollar weakness (more on that later). Watch 601/602 key support going forward.


ES daily chart, still in that channel, but they are selling that 5 DMA at 1387.25. BIX (financials) keeps on finding 20 DMA support and is holding the fort a little today. RLX (retailers) doing a much better job and approaching those new highs once again. Still getting a bearish feel to all this and the bottom of the channel at 1368/1370 could very well be tested this week.

That fat finger ES 1398.50 trade a week ago in the overnight session is coming to mind. A higher high pop this week at that level? It is weekly R1, after all. Trade it, don't love it definitely comes to mind, short or long. Right now, 1386.50 is still resistance. Not the same punch than NQ as XLE drops 1.2%. Frankly, I still regard SPX 1389 (see my posts last week) as brick wall for now, but we might not be done with elections low volume supportive jabs.

The buy the dips bull machine is back, albeit a little chastened. Equity bulls are breathing a little easier and they can thank the weather forecast and lower oil. It was quite surprising not to see NQ hit S1 and 20 DMA around 1718, but this heavy bid at any lows is becoming routine. But bulls should be very careful as we are also seeing some end of month adjustments which tend to be artificially supportive and some hedgies could very well be waiting for the right entry to sell this bloated market.

QM (crude futures) whacks a few stops below 58.65 support, now back at 58.70. ES hits 1386.50 resistance. Gold holds on to the neckline.

Techs hit it the ground running on an NQ bid above pivot and 50%. ES should follow and tag 1386.

December gold drops 609 support as oil loses 58.65, still bullish especially given the drop in energy. The mixed dollar is helping, but first and foremost, gold traders are a very savvy lot and they might be telling us something. Gap close is 601.10 on a drop, which is also ex trendline resistance from May and 200 day ema, so basically huge support. Neckline support from inverted H&S is around 605 and it could very well be all they give bears. Target on a 601/602 hold is 620. If crude manages a succesful bid from here (58.60), it could be back to the races.

Equity bulls smell blood as QM drops 58.65 support. Lots of noise still, so be careful.

NQ indeed getting slapped at 50% Friday/Monday, 1739. ER loses the 10 DMA battle for now. That one is turning out to be a real money maker shorting bounces.
QM (oil) is at a critical spot and you can see the conflicting forces at work. Everyone knows that a drop below 58.40/58.60 could kick in some very serious selling, probably down to 56.50, sp there is a lot at stake here.

Warmer weather fears by oil bulls are exaggerated at this point. There is still some cold spots and the outlook is not so bleak as to drive QM below weekly S1. Northern plains are still going to be subject to some harsh conditions.
Link

Watch ER and its 10 dma at 770.50. It is lagging on a relative basis, even though it is green today. What I discussed Friday still stands if small caps can't get back in that wedge.

As expected, oil finds support at 58.65 and equities stall their bid for now. NQ hits PP and 50%.

NQ and ER find resistance at respective 10 day moving average, ES finds support there. Watch ES 1380.25 for any sign of further deterioration. Sop far, it has been overnight support.

Oil keeps dropping. If 59 does not hold, next support is 58.65.

The drop in oil is supporting equities from further damage at this point. That can change, but NQ did a lower low from Friday with a slight bullish divergence. ES is right at 10 DMA. Can go either way, watch oil.

NQ going for a gap close at 1731.50. Keep in mind that there is risk to 1717 area, confluence 20 dma and S1.

YG weekly R1 at 610.75.


Gold got an extra kick, now up above the neckline. R1 at 607.90 is immediate resistance. Support is now firming up at 601/602.

BALTIMORE (MarketWatch) -- Jeffrey Lacker, president of the Richmond Federal Reserve, said he continues to be more worried aobut the outlook for inflation than a possible economic slowdown.

NQ and ER find resistance at respective 10 day moving averages, ES finds support there. Watch ES 1380.25 for any sign of further deterioration. So far, it has been overnight support.

Some pressure on oil as it dips below 60, but finds support at 59.50, 61.8% recent rally. If oil bulls can somehow hold on to 59.85, they could stem the decline, otherwise we could test 58.65 this week. Resistance is 60.20.

Sunday, October 29, 2006
Gold is doing the breakout I thought it would, now trading above 50 DMA and trendline resistance in place since May. This is an important move and if the lows hold, a strong bullish bias is established. Support 600.90/602, resistance 605. Inverted head and shoulder gets confirmation on a close above the neckline now around 605/607 which would give a maximum projection to 650, although I think 620 will be strong resistance. Watch the 50 DMA as well at 602.15. The 600 level is a must hold now for bulls as it coincides with 200 day ema and ex-trendline resistance. But with lots of gold bears out there, the squeeze could be on.


Always hard to predict what will happen in the coming week, but Friday's selling at the close was a first in seven days. A cursatory glance at the media shows lots of optimism and calls for "buying on a pullback", "this is great, an opportunity to get in" etc... That always spells trouble. Bulls want to see some fear and pessimism when we correct after a sharp rally. My guess is we head lower, probably test 1368/1370 level for ES. Maybe we get one higher high at 1398.50, before heading down. I would have a bearish bias now if they keep selling the close, so watch for early rallies that fail. Support is as easy as it gets: 10 day simple moving average accross the board. Mark it and trade it. Watch NQ for a heads up.

Saturday, October 28, 2006

The economy is slowing down, and possibly headed for a recession. Small caps get hurt quite a bit in that type of environment. One look at the Russell 2000 futures (ER or MR), and you can see the pressures building as it is the only index with a bearish ascending wedge about to breakdown. It also closed below its 10 DMA, again, the only one to do so. Friday's low was critical support, if we fall below those levels, we are out of the wedge and headed for the 755 level. Watch 768 support on Monday and 10 DMA at 770.80.

Friday, October 27, 2006

Gold is about to breakout from that downward trendline in place since May. This could be a big deal for the metal. 602.50. A failure would not be pleasant, but it looks like they are going for it.

1382 is the line in the sand for ES.

They are doing the best they can to hold this one up, but the distribution is evident. ES loses 5 dma at 1387, needs it back. We have a bullish divergence on that last low so it could happen, but I would short rallies now.

Nq does another bounce off 10 DMA at 1730. After the Feds, it was the same support (1728). We will see if they can hold this today. I am not so sure. In any case, the SPX high yesterday of 1389 was probably it for a while.

Bulls are not going to win this one today.

NQ closes the gap and bears put pressure on bulls. YM just can't get above its gap close either. Choppy day.

QM has clear support now at 60.20, weekly pivot.

Bulls are keeping the pressure on bears, even on a down day. COmsumer sentiment is helping, but it all rides on gas now. The end of month plays are supporting, no doubt. COMP is back above 2374 and for now, bulls have regained some control. Just be careful of that rising VIX.

NQ 1750.25 is 50% today. YM saw some bearish divergences at a dble top 61.8% yesterday.

COMP is right at 2006 highs. Internals are weak, but TRINQ showing support. ES hasn't quite closed the gap. It's a mixed picture and a day to scalp. I would say watch COMP 2374.

Ths dollar drop should keep on being gold supportive. Oil holds on to 60. It looks like some rotation into commodities.

Watch ES 1389.50. Let's see if the bulls pull out of this one.

Thursday, October 26, 2006
It was another day to buy the dip, this time NQ 10 DMA. It sure looked lke we were going to get some follow through to the downside until Greenspan spoke and oil fell below 61. In this market, hold your nose, close your eyes and buy support. It has not failed for some time. That day will come and probably very soon but until then trade it, don't love it. Some traders find it hard to switch intraday from short to long or vice-versa and there is nothing wrong with that. Just understand that if you play the short side, hit resistance only and take profits, don't hang around. The long side is still the easier trade, but it is getting riskier everyday, so I would not even hang on to that one either. Frankly, this market is becoming a great money maker for both sides of the trade, regardless of trend, especially this past week. The close has been invariably bullish, but intraday has had many good short set ups.


We can't leave the COMP out of this since it managed to make a new 2006 high. Upside target if 2374 holds is 2398/2400. Please note that COMP and NDX are both making highs with bearish divergences. Any of the upside targets mentioned are good places to enter short or at the very least take profits on longs.


NDX daily chart. If 1744 is broken to the upside and held on close, possible upside target is 1773.05. Key support is 1732.


Updated gold chart. Resistance is 600.80 and 602.50. Support is 594, 590 and 587.


Updated SPX daily chart.

Did you catch that sleazy YM drop 10 mns before the MSFT release? I hope they get nailed for that. Those trades should be easy to locate.

Thank you Al for bumping up gold. You're not so bad after all.

WASHINGTON (Reuters) - Former Federal Reserve Chairman Alan Greenspan said on Thursday that both private investors and central banks were shifting away from the U.S. dollar and toward the euro.

"We're beginning to see some move from the dollar to the euro, both from the private sector ... but also from monetary authorities and central banks," Greenspan told a conference sponsored by the Commercial Finance Association.

His comments pushed the dollar down, a sign that Greenspan, who retired from the U.S. central bank in January, still holds some sway in financial markets.
Link

SPX closes at 1389.06. How's that for on the money (Dec 00 high was 1389.05). YM and ES take a quick hit post close.

The game plan might very well be to take SPX to 1400, but it's best to take it one day at a time. The December 2000 high of 1389.05 marked a critical event, the beginning of a confirmed bear market with a close below the 20 month MA. If they ramp it up here, it could be significant and set up SPX 1450.

That ES high met some sellers. I was either banking on SPX 1383 or 1389, they gave us the latter, but note that both met selling. This one has a better chance of sticking as it coincided with an NDX fib as well.
This entire rally has been set up by giving everyone the biggest fears in May and running up the shorts on a wall of worry. Nevertheless, fundamentally, nothing has changed since the May sell-off, in fact, earnings are lowered in most cases. If they were scaring you to death in May and telling you now that everything is fine, they were either lying then or lying now. You choose. Swing traders and daytraders don't care either way, but the average Joe could be in for a surprise after the elections.
You may have noted that I am doing most of my posts on this site now. It will remain this way. I will on occasion give readers on the other site some tips, but for the most part, the action will be here. I plan on improving the system, so bear with me.

SPX reaches 1389, my secondary high target (Dec 2000) and 100% projection September.

NDX hits 1744, 76.4% 2006 with a solid bearish divergence (NQ 1757). It's also getting close to QQQQ 43 call resistance. YM is having problems today and is weak below 12206, 100% projection September. It's a tough day for shorts, but bulls should be aware of resistance. BIX has not made a higher high along with ES and NQ. Still feels suspect with TRIN and TRINNQ still above 1.

Retailers and banks still haven't made new highs, although NQ has. A little odd, especially with TRIN and TRINNAQ above 1.

Here comes the obligatory test of overnight highs for ES. Amazing resilience.

NQ 1743 is weekly R1.

Once we are done with the short coverings stabs, you can see the buyer exhasution. These advances are getting painfully slow.

Let's call this the Greenspan stop run bounce (he's making sure he gets those speaking engagement fees). Oil is back up above 61, with a double bottom at pivot and equities are still rallying even though the opening news was pretty lame. Normally, these events lead to a down day at the close but frankly, no one knows anymore how any day will finish. ES 1389.50 is still resistance with an overthrow at 1390.50, 61.8% today. Above that, they will go for the overnight highs at 1393.75.

Feel manipulated? It's not your imagination. You are. All these stop run pushes occur in low volume trading hours when we get down days. We all know what's going on, no need to beat the story any further, but this is not a sell and hold envrionment. Trade it.

Bulls are back, but watch ES 1389.50, weekly R2.

NQ 1739 is R, 61.8% today and confluence 10 and 20 ema hourly.

Greenspan comes to the rescue with some positive comments (...). Oil drops below 61 and now bulls better hold on to that ball.

Pre-lunch uptick, we will have to see if it is the start of something bigger to the upside or just a bounce in down day.

QM bounced off pivot and is now back above 61. The bear flags are confirming for NQ and we could see some more selling. Hard to tell, we have been fooled before. It all depends on oil now.

Second bear flag for NQ. Not what bulls wanted to see. Bears are in control below 1735 for NQ. But these days...

Oil drops and bulls get a break. NQ 1728/1729 holds (10 DMA). Let's see if they sell the bounce.

Cracking at the seams and falling apart. If NQ loses 1728/1729, it's over.

The drop is labored. They could have one more stop run push to the upside in them. But wath ES 1389.50 for any sign of failure. Resistance is 1392.25, 1395.25, 1396.50 and 1398.50.

YM is becoming the weakest link.

Watch QM 61.875 key resistance.

WASHINGTON (MarketWatch) -- Demand for U.S.-made durable goods soared 7.8% in September, the biggest jump in six years, as orders for new aircraft nearly tripled, the government said Thursday.
Outside transportation, however, new orders rose just 0.1%, marking the first increase in three months.
The jump in last month's new orders for big-ticket items far exceeded the 2.9% gain expected by economists surveyed by MarketWatch. It's the first gain in three months.
The increase came almost entirely from a jump in orders booked by Boeing Co.
Link

Gold is on a tear and looks ready to challenge the 600 level once again. This time, it should hold be able to keep it if it gets it.

The XOM numbers will probably raise the windfall profit tax issue on oil companies especially if a democratic congress is in power. It will be interesting to see how this unfolds, although a veto would be pretty much assured. The price of gas at the pump in the coming months will be a determining factor.

They blew ES right past resistance and R1. The pump machine is alive and well in the overnight session. However YM is below R1 and NQ did not even make it there. Watch ES 1392.25 now and see if it holds as support. If not, it's back down to 1390. Above that, 1395.50 comes into play, then 1396.50 and 1398.50.


Speaking of YM, how about this chart. Toppy...

Wednesday, October 25, 2006
I just mentioned ES 1390.25 and we hit 1390.50, but in my defense the 61.8% projection from last week was 1390.29, so let's not quibble. Close enough. It will be interesting to see if it pans out. R1 is higher at 1392.25, but NQ is still lagging (as far as new highs) so there is a chance 1390.50 was it and it does line up with YM 12198, a hair below 12200. They like those century marks. You do get the sense that 1398/1400 is targeted, but will it be a straight line from here? That would surprise me, especially since we have almost two weeks before the elections. But who knows. When cash opens, keep an eye on SPX 1383.37, 2001 high.

Watching the overnight action, I can't help but notice that once again ES is making new highs without NQ, at least for now. It's just amazing, but par for the course these days.

Oct. 26 (Bloomberg) -- Taiwan Semiconductor Manufacturing Co., the world's largest maker of customized chips, Co., reported its smallest profit increase in a year on weaker demand for semiconductors used in cell-phones and consumer electronics.

Third-quarter net income gained 33 percent to NT$32.5 billion ($977 million), or NT$1.26 a share, from NT$24.5 billion, or 95 NT cents, a year earlier, the Hsinchu, Taiwan-based company said in a statement today. Nine analysts surveyed by Bloomberg had a median estimate of NT$31.7 billion.

Taiwan Semiconductor's customers are reducing orders for custom-made chips as handset manufacturers such as Motorola Inc. try to clear stock because of slowing sales. Concern that U.S. economic growth and consumer demand may be dented by higher interest rates and oil prices next year may delay chip orders.
Link


ES has that 100% projection from September at 1398.50, but before we get there, I mentioned SPX 2001 high at 1383.37. If we look at ES fib projections from last week on this hourly chart, we can clearly see the resistance levels (1386.50, 38.2% is precise). 61.8% is 1390.25, and that woudl not exceed SPX 2001 high by much and could be the overnight high should crude keep a bid. If we do move above 1390.25, next stop is 100% last week at 1396.50 and then of course 1398.50. But for now, let's stick with 1390.25, a big hurdle.


On this SPX daily chart, you can see how we hit the January 2001 high of 1383.37 and retreated slightly. That was my upside target for the index (see yesterday), but if we close above, we should be headed for 1389, which is also 100% projection September. The ES chart has that number at 1398.50. ES 1389.50 pretty much corresponds to the 2001 high for the cash index. This is a defining moment for the markets.
Note that retailers, banks and techs are not making new highs, although the banks are close. It's nevertheless a red flag as far as I'm concerned, but we all know what has been going on with ES futures the past few weeks. Logic has nothing to do with it, it's all about headlines in the press and the elections. But it's not going to be that easy now as lots of money is at stake and you can bet some hedge funds are not with the plan and do not intend on sinking with the ship come November.

Watch VIX 10.60. It has marked turning points all year.

SPX tags my high target of 1383 after all. Techs are lagging while SPX makes new highs.
The dollar drops and oil rallies some more, so gold keeps the bid above 590.

Watch the dollar and bonds when the Feds release.

Lots of Gold shorts ahead of the Feds as they believe there will be tough talk on inflation. But the truth is, it will just be talk and no action. The housing slump is not going to allow for more rate hikes soon. Nevertheless, there is a perception that keeping rates at this level is dollar supportive and inflation containing. I would not be so sure about the latter. In any case, expect some whiplash after the Feds.

ES and NQ trading between respective pivots and R1. There could be a run of ES post Fed to 1389/1390 and that would come close to a target I have for SPX at 1383. We hit 1380 earlier and that could be it, but beware of the pre-election machine.

Oct. 25 (Bloomberg) -- Sales of previously owned homes in the U.S. fell last month to the lowest level in almost three years, prompting sellers to reduce prices.

Purchases dropped 1.9 percent from August to an annual rate of 6.3 million, the National Association of Realtors said today in Washington. The median price of an existing single-family home dropped 2.5 percent from September 2005, the biggest year- over-year decline since record-keeping began in 1969.

The year-long slump in residential real estate is the biggest drag on an economy that's slowing without stalling. Federal Reserve policy makers will probably keep interest rates unchanged today, partly because of the housing downturn, even as inflation remains above levels that Chairman Ben S. Bernanke considers desirable, economists said.
Link

Intraday:
Gold took an initial hit, but it was a big fake and now is trading above 590 resistance. Oil is skyrocketing and the dollar is lower. Good recipe to be long gold. That inverse H&S I mentioned yesterday is getting some respect.
NQ held on to weekly pivot and did a rally up to S1 and some, but is now stalling on the monster oil bid. SPX found resistance at 1380. ES 1387 is going to be pretty tough resistance if oil keeps this bounce going, but they will try one more push before the Feds, and then they should back off.

Tuesday, October 24, 2006

Gold is building a potential inverted head and shoulder, which would be bullish and suggest a rally to around 650. Nevertheless, the right shoulder is only one day old, so we need more confirmation. 580 is must hold support now.

NQ closes right at 10 DMA, but we have a bit of a breakdown after-hours as Seagate (STX) disappoints. Watch NQ 1723.75 support (weekly PP). STX bouncing as I type, so it might hold.

Once again, bulls pull it off and avoid a real correction on the TXN news. There is money at every dip waiting to get in and this mania could go on for a while. SPX looks headed for its next level of resistance at 1383.
The real winner today is gold, which did a remarkable bounce off key 576 support. Watch 583 and 585 going forward. Resistance is 590, 596 and 601.

Bulls hold on to the 10 dma and shorts give up for now. Still a bit of a toss up, but we will see where they close it. A solid close below the 10 dma for NQ would be a first this month, so watch it (1725.75).


Watch the NQ channel.

Bulls hold NQ s1 at 1716/1717 and we get the ususal short covering bounce, but unless they get it above 10 dma (NQ and COMP), they will be met with sellers. Currently NQ 10 dma is at 1725.75. QM ticks have been playing a part, but note that the ADDEC line has not really improved on the bounce. It could all change of course (what else is new), but that is the current read.

Intraday update 2:
NQ loses 1723/1724 support and the selling accelerates Testing S1 here at 1716, but the possibility I raised earlier of testing 1700 is getting more real by the minute. Must hold here for bulls.

Intraday:
NQ and COMP right at their respective 10 DMA's (1726/2344). These are must hold zones for bulls or NQ could test trendline support near 1700. In normal times I would say its a done deal. These days, I am not so sure. Nevertheless, resistance is now clear at 1734/1737. Gold tested the 576 level and bounced back into the morning gap. If it can hold 580.50, the worst could be over especially if we are in the process of forming a right shoulder on an inverse H&S.

NQ could very well test 1698/1700 soon.

Oct. 24 (Bloomberg) -- Merck KGaA, the German drug and chemical maker buying Serono SA, said third-quarter profit fell 20 percent and trimmed its sales forecast as demand slowed for liquid crystals for televisions and computer screens.
Link

The dollar keeps climbing ahead of the Feds and that is putting pressure on gold. Support below 583 is 580.50 and 578.35. I am not sure Feds will not lower in 2007, but the currency market is now placing reverse bets on Feds holding steady through next year. Inflation is a problem, but the gold market is reacting to the fact that dollar traders are bullish in their belief the Feds will sustain high rates.

Monday, October 23, 2006
I should have taken note that Bush was scheduled to speak on CNBC. No wonder they pushed ES and YM up for that event. It is starting to get almost surrealistic. Again, note that semis and financials are not making new highs.

TXN has a weak outlook and semis take a hit after hours. How long can this party go on without them?
Link


QM/CL held on to the July 2005 low of 58.15. As you can see on this monthly chart of December 06 crude, it marks an important support zone.

SPX 1376/1377 was just too tough, especially given the failure of the BIX to get above 10 dma. Gold closed the gap at 583 (see earlier post) and has now some measure of support building above 580, if oil keeps this bid above 58.20.
NQ was making lower highs while ES and YM made higher highs. Not a good combination for bulls.

Watch the financial, no rally can last without the banks. Right now BIX has resistance at 10 dma 397.81.
RLX (retail) is showing strength but there is resistance at 500.
If SPX gets above 1376.38 and stays there, next resistance is 1383.

Note to readers:
On occasion, I do more intraday updates. I recommend using the RSS feed feature on IE or Firefox. I am considering various options, including an email on every update. A live chat might be set up eventually. For now, use the RSS feed or refresh the page. Thank you.

Intraday 6:
QM does a lower low with a bullish divergence. In case you are wondering, 58.15 is the July 17 low of last year, where a pretty strong rally started. Obviously, price has memory here (58.15).

Intraday 5;
Looks like SPX Feb 2001 high (1376.38) was indeed the top of this push (see previous post). That should put pretty strong resistance for ES at 1383/1384, at least until the Feds tomorrow. VIX is in mega danger zone for bulls.

Intraday 4:
If Dec crude loses 58.15, they will try and take that contract right to a test of previous low for Nov contract at 57.70/57.80. Barring a complete meltdown, it should hold and provide support going forward. If that level is not meant to hold, the drop below could be pretty significant. I doubt it though, not until inventories on Wed.

Intraday 3:
Watch SPX 1376.38, Feb 2001 high. ES has risk to 1389 on a push above 1382, but I don't think we get much higher here ahead of the Feds.

Intraday 2:
The ADDEC lines have been getting stronger, enabling NQ to push above 1743. If that holds, next resistance is 1748, then 1750. Above that, we have a possibility of hitting 1767. Watch oil as it tries to find support in the general area between 57.75 and 58.50.

Intraday 1:
December crude has support at 58.15, then 58.05 and 57.70/57.75. December gold has support at 587 and 583 (Oct 12 gap close). Both commodities are buys on pullbacks, in my opinion.
NQ found resistance at weekly R1, 1743 and ES as well at 1382. Lines are drawn.

Sunday, October 22, 2006

They actually spiked up the futures on Sunday evening to ES 1398 and NQ 1747.75, then after wasting just about every stop out there, they have brought them down to Friday's resistance levels. It's right there in the time and sales and now of course, all the charts are messed up. It's either the blow-off top future's trade of the year, or they are actually going to take cash up there. A clue as to where they are going to take ES? It's pretty blatant manipulation and it's best not to fight it. Now that we are back to "normal", watch NQ 1723/1724 resistance.
If any of you got stopped out on this creepy move (2% in a few minutes, give me a break), please let me know by e-mail or comment.

Saturday, October 21, 2006

Let's take a look at the NQ hourly chart. The gap from October 16th at 1743.75 is still wide open and bulls need to get back above 1729.75 and work on it quickly. Patient bears are probably waiting for a bounce at or near that gap close to go in and hit it, since it was also near the high of the week prior to opex. It is also upcoming weekly R1, so watch that level next week. Your first clue that bulls wil be heading that way is a closing 30 mn candle above 1723/1724, weekly pivot last week, and next week as well. Big number with lots of noise around it. My best guess at this point is that shorts will hit NQ hard at 1737. It marks the ex trendline support now resistance as well as 76.4%. If bulls close that gap at 1743.75 and hold above at end of day, be careful as they could press on to 1765/1767. Any failure at 1723/1724 sets up 1699/1700 rather quickly. Let the tape show you the way.


At this juncture, I think one of the most important charts to keep an eye on is RLX (Retail). In early October, it closed above the previous all time high set in July of 2005 (489.34). That support level has been tested no less than six time since. There is a definite hesitancy in pushing this one higher and I would consider any close below 489 to signal the beginning of the end of this bull market, plain and simple. After all, the mantra of the past four years has been "consumer resiliency". If that optimism fades, it will appear in this chart before it does anywhere else. Watch it. Resistance is now 10 DMA at 495, so the noose is tightening.

Wednesday, October 18, 2006

Just a quick note before I leave: could be a blow-off top for ES which hit 61.8% projection September (1380.25, exactly) and dropped 10 points rather quickly. Semis are not on board and techs are hoping AAPL will save them. It's hard to judge with opex, but that is the picture we have now. In any case, the inflation headlines are deceiving and rely entirely on energy, which could get a bid soon. The inflation boogeyman is still alive and well. I'll be back Sunday.

Tuesday, October 17, 2006

The earnings minefield has begun and the picture is mixed, altough it seems to me everyone that is making the cut is only beating already reduced estimates (remember Q2?). Just an unhealthy rally with old names from an old bullmarket being recycled once again for the masses. But they will keep plugging this nonsense right up to the elections.
NQ right back in the old wedge, resistance at 1731, which is coincidentally the gap open from Tuesday. Gap close is 1741, if we get a spike tomorrow. They will try and drive the Q's up to 43, too many puts where we are.

I'll be out of town for a few days, but back this weekend just in time for the next round. I will be doing more posts on this forum, as I have decided to cut back the time I spend on the optioninvestor.com monitor.


Intraday update 4:
Here is a 30 mn chart of December gold. If YG can't get past 595 rather quickly and QM falls, there is downside risk on a break of 589 to 587 followed by 583 gap close from October 6th. Since trendline support is around 585, I would consider that area (583/585) to be the line in the sand for gold and a great place to accumulate more of the metal should it hold. But so far, 20 dma at 589 is holding up, so the point might be irrelevant. In any case, that's the set up.

Intraday update 3; NQ finds support at 10 dma and bounces. Remember that sell-offs in an uptrend are usually bought at key support levels, unlike sell-offs in a downtrend. You must always factor in the overall trend. As long as NQ trades above the 20 dma, the trend is up.

Intraday update 2: crude oil loses 10 dma support, but has day S1 at 58.70 which should hold up given the oversold intraday oscillators. Gold is holding up above 20 dma, if that breaks, there is risk to 587, but with the inflation data creeping in, I think we will find buyers at some point.

Intraday update:
NQ loses weekly pivot support at 1723 and ES is about to do the same at 1366.50. NQ did find support at 10 dma(1713.50). The internals are pretty ugly, so if NQ loses 1713.50, it could head down to 1701.75, weekly S1 and where I think we will find strong support. But first wait and see if we hold the 10 dma, which is also close for ES (1364.25). Gold drops along with crude, but finds support at 20 dma (589.20). The dollar is down, so if crude finds a base here at the pivot (59.40), YG should be able to hold its 20 dma. Right now trading at S2 (591).
This is option expiration week, so things could get volatile.

Monday, October 16, 2006

Things are getting interesting, to say the least. Today, we rallied even though oil kept creeping up (remember, lower oil was one of the so-called "reasons" to rally into the fall) and financials were taking a hit. Higher energy will fuel more inflationary talk (gold is definitely pointing the way: I have been pounding the table on gold for some time, I hope you bought some) and the inverted yield curve occurrences this year are starting to raise the curtain on stagflation (slower growth and inflation). After the bell, we are seeing some selling pressure, but don't expect any mass exodus quite yet. That might have to wait a week or two, but be forewarned, it is coming. Once they funds have put in their numbers and gotten enough new clients to fuel their outrageous bonuses, the kiss goodbye will be right around the corner.
For now, I expect a retrace for NQ and ES to respective weekly pivots, 1723 and 1366.50. I would not count on much lower than that as put support is building at QQQQ 42 strike, although at this point it is a toss up as to how much lower than 42 we could correct. Nevertheless, they will try and run the Q's to April's high of 43.05 at some point this week.
SPX (chart) stalled at 1370.20 just shy of 61.8% projection September (1370.78) and not coincidentally home of SPY 137 call resistance, so bulls are getting their work cut out going forward.
Link

Sunday, October 15, 2006
OPEC sets up an emergency meeting to discuss production cuts and that should give QM (crude oil e-mini future) a boost and possibly hit equities at the open. Watch QM 59.175 resistance and 58.70 support. Should oil get above 59.20, we could very well hit 60.10, next level of resistance. If equities pullback, look at support for ES at 1365/1366 and NQ 1721.50/1723. Gold should continue moving up along with oil. Support for the December contract (YG06Z) is at 588/589, resistance is 601.10. If oil fails to hold above 59, techs could make a stop run overnight push as Samsung just reported good earnings in Korea. Resistance with NQ is at 1744, 1746 and 1750. This market has not traded the obvious and it is in the habit of running shorts to the burial grounds. It will change one day, but for now, that is the game in town. I think option expiration week could see a QQQQ flush down to 41, but that has been a hard game to predict lately. Max pain is at 40.
Link


Bulls keep charging. If ES can hold a 30 mn candle above 1374.50 (50% projection September), then the next level of resistance is 1380.25, 61.8% projection but also confluence monthly R2. Given the call resistance this week for QQQQ between 42 and 43, that should provide a buffer for now. Ultimately, I think ES is headed for 1398, but we should get a pullback next week.

Thursday, October 12, 2006

The VIX is back down in lala land. It's not a good short term market timing tool, but I can tell you that if we get closer to 10, (my bands say 10.50), many funds will take notice. The complacency surrounding this rally is leaving no room for error. One big tech warning and the rush to exits could be interesting. So far, so good.


Semis kick it in, pushing SMH above 200 dma, finally. However, QQQQ stalls right at 50% projection September (see chart). Next stop if that is conquered (42.27) would be 42.57. Keep in mind that QQQQ 42 pc ratio is at .77, not very supportive and 43 has more definite call resistance. That should still put massive overhead resistance at NQ 1749/1751.

Wednesday, October 11, 2006
Isn't it interesting that on the plane crash scare, NQ went straight down to the support level I had mentioned yesterday at 1685 and bounced right back up. Same with ES and the 1350 level. Does that make it the pullback we needed? Time will tell, but the lines are drawn.
In other news, T Boone Pickens re-affirms 70 oil by year end. You will have to factor in the price of the December contract, now almost $2 higher than November, which ceases trading next week.
Link

Tuesday, October 10, 2006
My updates will be sporadic the next few days, as I have some business to attend to. The game plan remains to expect a pullback to prior resistance, DOW 11750, SPX 1340 and QQQQ 40.95. For futures, that would be ES 1350 and NQ 1683.

Monday, October 09, 2006
Overnight update 2:
No big dollar rise, in fact the Canadian dollar is doing much better thanks to the oil breakout. This should help gold hold its own. US equity futures come off lows, but still look defensive. Some might argue that they will not let this market fall apart ahead of the elections. There definitely always seems to be a supporting hand showing up, let's se if they do that hat trick again.

Sunday, October 08, 2006
Overnight update:
Korea tests a nuke.
The dollar will tell you how much real panic there is. Usually, unless it is an attack on the US, there is a flight to safety by buying dollars, so the dollar should rise. Gold is going up along with oil, which in turn is going up on the OPEC news. Equities could be the hardest hit should Asian currencies get hurt. There is no real panic, but US futures are unable to get a bid at lows. Bonds are closed tomorrow so equities will be flying on their own. Stocks are overbought and at resistance already so there is no need for anyone to chase this. Big week for earnings and traders could play it safe by booking profits at this point. Just note that it is very likely the cash strapped North Koreans shorted Asian currencies and markets ahead of this and they will have to cover at some point.


The basis for the entire rally has been the drop in interest rates. The ten year note chart is clear. Friday's candle is a warning to equity bulls. It blew past five down days in one single day. 4.8% is not far above and if that happens, stocks could find some real headwinds. Remember: it's all about rates. Watch 20 DMA support at 46.78.

Equities are right at resistance, especially NDX/QQQQ. We "should" pull back soon and retest that breakout area that served as resistance in September. However, it's important to keep in mind the number of bearish bets out which provide a floor for the markets. My guess is that once we get near the end of October, those bearish positons will lighten up as everyone expects the usual end of year run-up. That could be when the real danger starts. We've had quite a long and steep rally since the July lows and bulls are pushing the enevelope. Just remember that the markets can remain irrational longer than you can remain solvent.

This should start an oil bid that stays above 60 next week.

Oct. 8 (Bloomberg) -- Saudi Arabia and five other OPEC members cut oil output by a total of 1 million barrels a day in an effort to revive prices that lost a quarter of their value in recent months, a spokesman for the group said.

Link

Friday, October 06, 2006

With a little help from Greenspan (see link), the markets avoided a more serious sell-off. Neverthless, NQ chart looks ready for a pullback to at least 1684 if it can't get cracking above 1705 soon.
Link

Thursday, October 05, 2006

All time high for retail stocks, per RLX. Give me a break. Right before earnings, a possible recession and during a housing slump. What kind of valuation are they putting on a slowdown? It has reached the level of fantasy. In any case, it was done with a bearish divergence on the monthly chart. What else is new...Please be careful.

Vista is a memory and graphics hog, so when you look at so-called Vista stocks, also look at companies that sell ram and video cards as well as hard drive memory. NDX Vista: MSFT -.07%, INTC -.19%, ATYT - .28%, NVDA -2.83%, DELL + 0.65%
Non NDX Vista plays: MU -10%, AMD -.15%, WDC -1.15%, STX -.70%.
The reason I bring this up is because of the inventory build up that has been hurting the semi group recently. Simply looking at DELL or MSFT does not give you an idea as to what is happening with the core stocks that are supposed to benefit from Vista. They are all down today while NDX rallies, except DELL, but that is suspect, as the stock is always bought by retail on stock market rallies. In other words, how long can we keep going on software and Starbucks? The core group that revolves around computers is not participating today and that includes AAPL, a non Vista play, but a retail force nevertheless.
Granted, these stocks have seen a run-up, but if they are down today while the market is up, then it tells you we have some profit taking coming pretty soon. I'm not saying we collapse, just that players are taking money off the table in key areas that drove the rally earlier.
As we press forward, keep an eye on the biggest beneficiaries from Vista: MSFT, MU, NVDA, ATYT, AMD, INTC and STX.


NDX finds resistance at 23.6% projection September and right around 76.4% 2006. MU misses after the close and the semis could be under more pressure. QQQQ call resistance at 42 and minor put support at 41 gave us some stoppage at 41.50. SPX has rather large call resistance at 1350. All in all, we are due for a retest of breakout, i.e DOW 11750, NDX 1665, SPX 1340, NQ 1684, ES 1350. They might shoot for YM 12K first, so mind your step.

Wednesday, October 04, 2006
SPY 135 October strike pc ratio .38, QQQQ 42 strike .35. SPX is right at 1350 and QQQQ is still .70 away from the 42 strike, I would put more faith in an NQ/QQQQ upside move here. Nevertheless, the pendulum has shifted to call resistance now. But I have a possible upside target for SPX at 1367/1367 if we hold above 1340.50. Crude oil has found a bid again, this time with a real OPEC cut announcement. Resistance there is 60.60, support is 59.
There is still some skepticism out there, so the rally could press on now that we have had some breakouts, but small caps and semis still lagging. That has not bothered bulls the past few weeks, but expect some distibution at some point. The market remains a buy on pullbacks as long as NQ stays above its 10 DMA. This is the disbelief stage of the rally now that bears could not press on when they had a chance.
As a reminder, earnings season has not even started and big caps are pricing in glory days. It remains to be seen if they will deliver already lowered forecasts. There seems to be an unseen hand supporting stocks ahead of the elections, so if you are shorting remember that markets can remain irrational longer than you can stay solvent. If you want to short, make sure you hit bounces and not drops or you will get hurt.


The bulls ramp it up and we haven't even kicked off earnings season yet. Breadth was solid, it was a bona fide rally. When NQ broke through 1661, there was no looking back. Nevertheless, ES topped at exactly 100% projection off wedge axis (see chart). Will they try and go for YM 12k? Let's party while there is still time...


Decmber gold lost key support at 590 and below that 586/587. You con't argue with that kind of a move. The charts point to a retest of 560 should support at 576 break, but I think if that happens, the lows would most likely be closer to 545, around the January opening gap. We did close a recent gap at 579 and found modest support overnight, but it does not look very promising so far. However, a close back above 590 negates the bearish scenario. For now, patience would be the best course. Oil will find its footing at some point in the near future and that will be the trigger point once again. My longer term bias remains bullish on gold and oil. The possibility of a 70's stagflation scenario is still very much alive.

Tuesday, October 03, 2006
Very strange day. We make new DOW all time highs, but techs and the SOX lag and the advance decline line is somewhat pitiful. The energy sector is downgraded sending oil to lows not seen since November of last year while SPX rallies even though most of the earnings growth the past three tears has come from energy. Gold tumbles even though North Korea will launch a nuclear test and prospects for a higher dollar are dubious at best. Inflation is still a problem, it might not be energy related but the core rate is well above the comfort zone. In any case, not a time to be a hero in any sector.
NQ has stiff resistance at 10 DMA and weekly pivot, 1661/1663, so keep an eye on that one going forward. If oil inventories tomorrow are plentiful, they could send crude down to 57.50/57.75, where it should find some measure of support. December gold closed a gap at 579 and we will see how it holds up with the Korea business.
The market seems in to be complete denial while it pursues the "all time high" quest. Earnings warnings, geo-political red flags and a slowing economy are dismissed as non-events and all that matters is lower oil. We'll see about that, but for now, hedgies are having fun hitting the stops of all the shorts out there. Bull are on thin ice if you ask me.

Monday, October 02, 2006
Ok, we got it, finally. It was pretty swift and orderly. COMP held 2237 (for now) and if NQ can hold 1540 and QQQQ 39.90/40, I would not get too cozy if short. Markets don't switch trends that easily and there is still lots of put support right below. Nevertheless, bears have the ball and one should stay short NQ below 1661. Tomorrow could get rough for semis with the MRVL news. We will see if techs can pull out of it, but stay with the flow and don't be a hero quite yet.

Sunday, October 01, 2006

The DOW was not able to crack its all time high but YM (DOW futures) was the one to watch on Friday. It hit an all time high for a front month contract at 11808 and an orderly retreat followed. The re-drawn chart puts us in a wedge and now clearly sets up the S/R levels. YM 11,600 will be the number to watch in the coming days. The cash index is about 65 points lower so that would be DOW 11,550 or so. On the other hand, bears need to keep in mind that sometimes the cash will follow the futures target which would mean that the DOW could very well put in 11,800 itself in the near future. Nothing is set in stone, including the calendar, which has been the opposite of last year.

The COMP closed the May gap and that was pretty much resistance as the week drew to a close (2272.70). It too is sitting in a bearish ascending wedge, with an upside resistance target at around 2290 and support at around 2245. The 5 DMA provided support Friday, but it was a bearish close at lows and that usually means some follow through on Mondays and probably a test of support which is not far. Must hold is 2236.
Since I am seeing some weakness building in techs, I would keep an eye on NQ (NDX futures). Target support on a pullback will be 1661/1662, confluence 10 DMA, weekly pivot and daily s2. Quite a magnet, but of course watch last week highs at 1683.25
A lot will depend on oil, which is now finding clear support between 61 and 62.
ISM (expected 53.7) and construction spending due out at 10 AM tomorrow. They will be an excuse to sell or buy, thus market moving.
Again, trade it don't love it.
Link