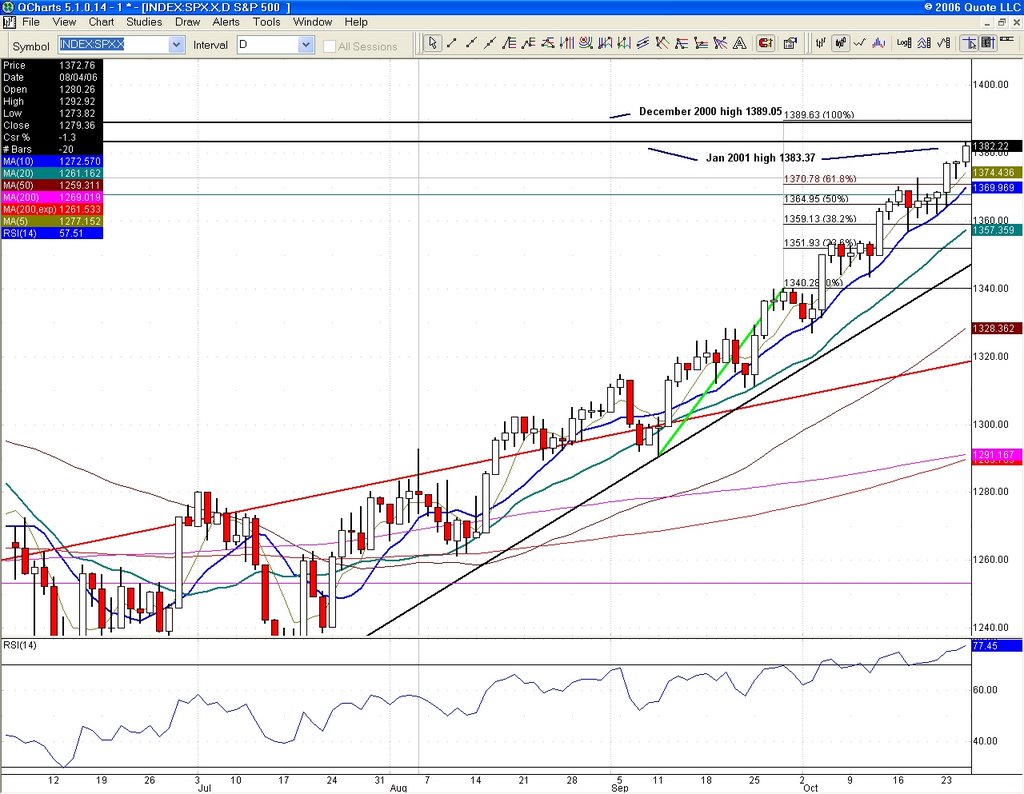
On this SPX daily chart, you can see how we hit the January 2001 high of 1383.37 and retreated slightly. That was my upside target for the index (see yesterday), but if we close above, we should be headed for 1389, which is also 100% projection September. The ES chart has that number at 1398.50. ES 1389.50 pretty much corresponds to the 2001 high for the cash index. This is a defining moment for the markets.
Note that retailers, banks and techs are not making new highs, although the banks are close. It's nevertheless a red flag as far as I'm concerned, but we all know what has been going on with ES futures the past few weeks. Logic has nothing to do with it, it's all about headlines in the press and the elections. But it's not going to be that easy now as lots of money is at stake and you can bet some hedge funds are not with the plan and do not intend on sinking with the ship come November.
This entry was posted
on Wednesday, October 25, 2006 at 5:25 PM.
![]()
![]()