AheadoftheNews Blog

A blog on market moving news and futures trades.

Wednesday, May 31, 2006

The monthly chart of TNX (ten year note) shows that we topped out in May at August 2001 high (51.92, or 5.19%). A push above sets up 61.8% 2000/2002 at 53.91. Keep a close eye on May highs.

Line up your monthly pivots with various fib and gap numbers. For NQ, we have a June monthly pivot at 1622.25 which is in the May 16th gap (1619.50/1628.50)and 38.2% retrace of the month. A push above opens the door to 1646.50, 50% and not too far from the 200 dma for NDX. For ES, keep an eye on the potential bullish cross of 5 dma and 10 day ema. It is encouraging that SPX bounced once again off 200 dma and 2003 trendline support with many non-believers in the media. Always helps. But remember that there are many investors who want to get out on any bounce as the same media has done a fairly decent job of terrorizing everyone. Nobody wants to be the fool they were in 2000, especially reporters and analysts. I still view the negative sentiment that is accompanying this correction as potentially short term bullish, or at the very least supportive. Just understand that being the minority in a trend is dangerous, unless we are at extremes (are we?). Don't stay married, trade it.
This is a whole new month starting, but we have critical data ahead of us this week, so mind your step.


A veritable swiss cheese of gaps above us and bears should understand that risk reward favors NQ (NDX e-mini futures) to go up and close at least three of them in the coming weeks.

Sell in May does not mean go away: Link

Tuesday, May 30, 2006
Tough day as various levels of support were taken out. NQ sliced through weekly S1 like butter in the closing minutes, but is recuperating after hours and ES found support at that level. As I commented last night, we might find a base at weekly S1 and get into a trading range, but if NQ can't regain it soon, all bets are off. To say that the selling is overdone is to put it mildly. Chip forecasts have been raised (see link) but no one cares. Bears are in control. Keep in mind that we have end of month games going on and the real awaited piece of economic news is the jobs report on Friday. For now, conservative traders should wait for a close above the 10 day ema to go long, but the more adventurous type might start nibbling again on an overnight drop. Watch ES 1258.25 key support now.
Link

Monday, May 29, 2006
NQ (Nasdaq 100 e-mini futures) weekly pivot is at 1593, a few points above 5 day moving average. Watch the overnight action and 1610 resistance. This bounce could take us up to 1629, weekly R1 or 1573.75 weekly S1 on an early failure. I like the first day of trading of the week, when you can very often get a solid low or high for the week if a trading range lies ahead. Use weekly R1 or S1 as a entries for possible reversals. Should these levels break on either side, forget about a trading range, a strong upside or downside momentum will be in place.


At this point in the game, bears usually start attacking again as we hit up against QQQQ's 10 day exponential moving average at 39.50. Any oversold bounce usually meets this fate and it is critical for bulls to hold on to the 5 day moving average, now at 39.05 in oder to maintain any hope of stopping the bleeding. It seems everyone has pretty much given up on the old tired bull of 2003, so there is still a chance surprised bears could start a short covering rally that would eventually takes us up to 40.16. After that, it is anyone's guess, but first things first and bulls need to hold 39.05. Keep an eye on gold, it has been giving us many clues lately. A strong rebound in the metal would signal trouble for stocks and lower lows.

Thursday, May 25, 2006
I rarely do plugs on my site, but this one, I have to. Try and see "An Inconvenient Truth", a film on global warming (futures traders, this is relevant... remember last summer?) New Yorker review:
Link


The most important fibonacci number in chart retraces and projections is 61.8%. The so-called "golden fib". Yesterday, NDX hit an exact low at 61.8% projection from January High/Low.


Nice bullish day with QQQQ marching above old November gap close and setting up a test of 10 day ema at 39.50 soon. We will take it from there, but it is very encouraging to see advance decline lines match the bullish numbers. VXN (Nasdaq Volatility index) did a massive reversal as fear unwinds and closed below the 10 day ema (see chart). Now bulls would like to see the influential SOX join the party. Expect some consolidation ahead of the holiday weekend.

Intraday update: Got the follow through on the COMP and a V bottom so far, so bulls are starting to hit the accelerator a little. Also noting a nice wall of worry that keeps building. The only hitch is a weak SOX and rising oil.

Wednesday, May 24, 2006


Finally, some positive developments worth noting. The COMP (daily chart)closed the November gap (see previous posts) followed by a strong reversal into the close and the SOX did a clean bounce off 50% 2004 H/L (weekly chart). However, advance/decline lines were negative at the close and we don't yet have any confirmation a bottom is in. But there are definite signs of seller fatigue and some bulls stepping to the plate. COMP needs to close above 2175 and QQQQ above 38.97 before we can start calling short term trend reversals (5 day moving averages).

Tuesday, May 23, 2006

QQV (QQQQ Volatility index) printing a lower high with QQQQ/NQ printing a lower low. Another bullish divergence that will be negated? I certainly hope not.

Article on investor mania, quoting Russell strategist Stephen Wood:. "... investors bolt into hot-performing assets just in time for the peak and similarly, they shun undervalued stocks when markets are in retreat mode, he said, thereby reversing the "buy low, sell high" mantra.
"The way our brains are constructed, when markets are up or down big, it affects the way people perceive information and make decisions," Wood said. Investors ride euphoric highs and ignore risk in bull markets, while becoming overly depressed and paralyzed in bear markets.

How are you feeling now? Relax, you are not the only one, but the ones who will make money are the ones not freaking out at the bottom. Up there, yes, get scared. Down here? Look for opportunity.
Link


If you were disciplined, your stops protected you today. Looks like a real gap down open coming as remaining bulls throw in the towel. This is of course when you should step in, but you are too scared or bruised to do so. If you are game, use entries with tight stops on a drop to weekly S2 for NQ (1545). COMP downside target is 2145 November gap close. Odds for a V bottom rally are increasing as enter lala land, 6% away from 20 dma for NDX. It's getting a little silly.

Gone, evaporated and SPX closes below 200 dma on low volume and minor ADVDEC line loss. This is either the grandaddy of all headfakes to the downside, or they will drop the open on volume.

We have a rally. Watch 5 day moving average support for QQQQ/NQ and old gap close QQQQ 39.35 for resistance. If we can close above, it sets up NQ 1625 and further up weekly R1 at 1640. ES already hit weekly pivot, thanks to energy.

Monday, May 22, 2006
Any rally will now hinge on the ability of QQQQ to hold Friday's lows at 38.75. For NQ, the number is 1581.25. SPX cannot afford to fool around with that trendline support from March 2003 lows (see last post). 1250/1255 must hold.


SPX hits 61.8% 2000/2002 and uptrend line support from 2003 low. Another good odds long.


Intraday update: NQ (30 mn chart) and QQQQ hit a lower low with a bullish divergence. COMP hits November gap open (daily chart), with a bullish divergence and bounces. There is still risk for gap close there at 2145 or so, but the long trades can start being initiated. Just use tight stops. Once a bounce starts, look for NQ 1585 to hold.

Sunday, May 21, 2006

Looking at NQ (NDX e-mini futures) pivots, weekly R1 lines up with the 10 day ema at 1640, which in turns corresponds to QQQQ 40.16. That is also the January low for QQQQ. Obviously, the level for bulls to reconquer and the level for bears to attack. To add a little twist, January low for NQ is higher than 10 day ema 1665, which is also a gap close from 5/12. That number for QQQQ is 40.74. A rally could take us to either one of these levels. But this is all dependant on QQQQ getting back above 39.88, Tuesday's gap close. No one ever said it was easy.

Friday, May 19, 2006

QQQQ ex-trendline support from April 2005 lows, now resistance, is at 41.15, which is also 20 dma. As I suggested in my previous post, the first area to overcome will be NDX 1635, which is ex-trendline support from October 2002 lows and would correspond to QQQQ 40.16 or so, at the 10 day ema. If we manage to break out above 40.16 (where I recommend taking profits), then there is a definite chance we will move right up to 41.14. But make sure you don't get married to any bullish bias once we start hitting QQQQ 40 on a rally. It could be somewhat treacherous above that. Many traders took some longs at QQQQ 40 and they will try and get out at "even", giving us some selling pressure when we get there. That is the nature of the beast. There is a possibility we put in a low but I want more confirmation. We've seen some real damage and we might meander some more before finally breaking out to the upside on a sustainable base. If we lose QQQQ 39 support, next stop will be 37, 100 % projection of January H/L. Not a pleasant thought, but it could very well happen if any rally fails to hold above 10 day ema. The good news is that bullish advisors have completely disappeared (see Mark Hulbert article and link below)and equity put to call ratio reached a closing high of .80 on Wednesday and was followed by two back to back readings of .75. Any equity put to call reading above .75 is unusual and a sign of pronounced pessimism. although I hasten to add, not an extreme. As for total put to call ratios (index and equity), the October lows of 2005 had five closing back to back readings above 1. This week we saw six closing back to back readings above 1, including 5 above 1.22 and one above 1.5. Monday saw an intraday spike to 2.20. Everyone is getting quite bearish indeed.
Link


There is enough skepticism out there to support a decent rally, but we have a minefield of economic data next week. Frankly, I think the Feds are done for now and will say so in June. "Kansas City Fed President Tom Hoenig said in an interview with the Wall Street Journal that the Fed is well aware of the risks of overshooting on interest rates. He said he expects core inflation to moderate despite the 0.3% increase in the core consumer price index for April reported earlier this week.
"Let's maybe be a little bit patient here, and then decide what the right course is," Hoenig said.

But that is in June. Right now, let's see how any rally behaves. NDX 200 dma is at 1650 which is right above ex-long term trendline support, now resistance (1635)(see chart). Of all the numbers, I will be watching that the closest. That should be NQ 1640/1650. It is absolutely critical to get back above that and stay there. Failure to do so will usher in the possibility of a retest of October 2005 lows for QQQQ. If long, I strongly suggest you take partial profits at 10 day ema, right at that trendline and take a wait and see attitude (QQQQ 40.16). It's a nice trade from here, so don't get too greedy.
Link

Intraday update: like clockwork, once NQ broke 1594.75, we went down and tested weekly S2 at 1583 with a little overthrow to 1581.25 and have now bounce back and never looked back. QQQQ should close above 39, setting up a nice tail below us on the daily candle and groundwork for a rally. DOW found support at 11,100. Banking, retail and semis are up, so there is a base. Yes, it's risky, but if you don't buy here, you are in the wrong business. We only get one of these once a year, if that, so whether or not it will last, it is of no consequence. You move up your stops to even and let the market tell you what it will do. Long NQ in the monitor at 1583.25, stop raised to even.
Right now, you look at the chart and see that the past two days of selling mean nothing as we are right back where we were and above. That is called "the last days when you make the herd sell their stocks to us cheap after we get Maria Bartimoro to start them all selling". I know, I am being cynical, but if the market is efficient, then in knows all along that it will go right back up anyway. "You" just don't know it until it happens and then you struggle buying over-priced stocks while Cramer pounds the table again. You look back and take chart classes and see that, hey, that is why they bought here. But you didn't, because it is rigged to not make you take that decision when it is the right time to take it. Never fish for a bottom? Hogwash. Just take small losses as you work your way in. That is what stops are for.

Open update: I guess one thing we can count on is Friday option expiration week staying in its usual dull self. The gap was filled for NQ at 1594.75 and we might have to wait for Monday for the shorts to get jammed. Bulls would like QQQQ to close the day above 39.35. INTC has recouped most of the after-hours losses, at least for now. The SOX is bullishly above 480, even with the INTC drop. Resistance there is 486. NQ needs to hold 1594.75 if we do not want to see new lows. A break of 1594.75 sets up a test of weekly S2 at 1583.

Huge gap up building in the overnight future's. Looks like nobody wants to miss the train. We could have a much more exciting Friday than I thought.

Thursday, May 18, 2006

VXN (Nasdaq volatility index) (chart) obliterating the envelope several times over, indicating we are very close to a market reversal. That does not mean we put in a lasting low, in fact I would only chase a rally up to NDX/QQQQ 200 day moving averages and then wait and see, or maybe even go short. I think May is going to stay tough all month, so be careful and book 'em fast. June has much better potential for a lasting rally. I any case, bears are getting a little hoggish here and odds are increasing we will get a nice pop soon.

QQQQ holds on to 39, but over 5% away from its 20 day moving average. To say the selling is overdone is to put it mildly. After-hours, INTC geting clobbered on the news that DELL will use AMD server chips by year-end. This could affect the Q's, but it is compensated by a 5% bounce in DELL. We might have to wait for Monday for a real bounce. The reaction in INTC seems way overblown since the AMD chips will only be for year-end and only certain chips, not the whole line. But the markets are nervous now, it's sell first, ask questions later.

AUSTIN, Texas (Dow Jones)--Dell Inc. (DELL) Chief Executive Kevin Rollins said Thursday he doesn't expect his company's decision to use chips from Advanced Micro Devices Inc. (AMD) in some products to hurt its relationship with Intel Corp. (INTC).

Intel is "still going to be the supplier of the vast majority of our processors," Rollins said during a conference call with the news media. "We would anticipate that would continue."

Dell announced late Thursday that it will introduce high-end, multi-processor servers that use AMD's Opteron chips by the end of the year. Intel traditionally has been Dell's sole supplier of processors.

Rollins described the decision to begin using the AMD chips as a nod to customer demand.

It was "due to customer requests," he said. There is "a desire for the technology that AMD has had to offer."

Still, he said Dell will be buying relatively small numbers of AMD processors, because they only will be going into the high-end server line. He didn't comment on the prospect of Dell eventually using AMD chips in other products.

Shares of AMD climbed 14.5%, or $4.55, to $35.90 in late trading Thursday after closing the regular session up 1.9%, or 58 cents, at $31.35.

Intel shares fell 5%, or 94 cents, to $17.71 in late trading Thursday. Intel closed the regular session off slightly at $18.65.

Intraday update:
The bounce is weak with the SOX red another day. Lots of calls have suddenly built at the QQQQ May 40 strike, telling me they will pin us below until the week ends.

Wednesday, May 17, 2006

Nine percent correction for QQQQ and over ten percent correction for NQ (NDX e-mini futures) from January high. We also have a 50% projection off January H/L, a nine to one NYSE down day on highest volume of the year for QQQQ and nine straight days of selling for the SOX. This was the washout day I was waiting for. There is little doubt in my mind we put in a bottom for now, or very close.


Intraday update:
November gap is closed for QQQQ and NDX. See attached chart with 4% envelopes off 21 day ema. Bears should be careful as a swing reversal is imminent.

Tuesday, May 16, 2006

Tomorrow is when we will find out if there is one more wash out low. QQQQ has a gap from November to close at 39.35, should 39.75 support break (see Saturday post). It would line up with NQ 1611/1613, weekly S1 and NDX gap close as well. This would pretty much end the selling this week if it were to occur. There is strong put support at 39, 40 and to a lesser extent 41. Keep in mind that once that gap is closed (again if that is the plan), the bounce back up to 40 and above could be pretty quick. I do not subscribe to the total meltdown scenario, not if oil keeps dropping. We are now 4% below the 20 dma and that has invariably acted as support in extreme cases.

Monday, May 15, 2006

VXN chart (Nasdaq Volatility Index). As some of you who subscribe to this blog already know, I tend to put lots of credence in the 10% envelopes off 10 day ema as a gauge for imminent reversals. We had a strong spike on May 6th, followed by a drop and another spike, weaker this time, but taking us to the outer range. That is somewhat unusual, as spikes out of the envelope rarely see a re-occurence a week later. What does this mean? Either we are completely overdoing the fear, or we are about to begin a crash as panic starts building. What I do know, it's that this is a new development. Options are about to get more expensive as price swings widen. I urge you to remain cautious, but with the understanding that betting on a crash is a very low odds scenario. We are poker players in this business: there is lots of skill, but without the risk taking, there is no big pay-off, no matter how smart and savvy you are. Watch this index tomorrow and try to spot divergences (i.e. VXN highs not matching NQ lows, VXN lows not matching NQ highs etc...).


The NQ 1619 low held and since it is close enough to a 10% correction, we can assume we have some kind of a bottom put in for the week especially considering the vast amounts of puts sitting at the 40 strike for QQQQ.
SOX lost the 200 dma, but did manage a close above 50% oct 2005/Jan 2006 and a bounce off 61.8% 2004 H/L. SMH closed above the October trendline, and the COMP climbed back up above its 200 dma (2229). Things can change of course, but I now expect some kind of rally up to the 10 day ema for NQ and QQQQ. That would be NQ 1674 and QQQQ 41.18. Since the weekly pivot for NQ is 1670, I would not count on much more than that, at least for this week. There has definitely been some technical damage and what usually occurs in these cases is a "sell the rallies" bias. But don't listen to the media, who are caling for the demise of the tech sector. Frankly, this severe drop in oil is far more bullish for NDX/QQQQ than SPX. That said, if the COMP closes below the 200 dma, batten down the hatches.

Sunday, May 14, 2006

SMH (semiconductor holders) has not violated trendline support off October lows, now at 35.65 or so. Keep an eye on that as well tomorrow.

As futures head lower, I cannot discount the possibility of hitting weekly S1 at 1612/1613 for NQ, which would be a gap close for November QQQQ, or close enough (39.37) and a 10% correction for NQ, something traders have been waiting for since this bull started in October 2002. Right now, the action is very bearish overnight and we already hit 1619, which might also be the low for the cash session tomorrow. This could also be a bear trap with a V bottom set up for tomorrow. Stay out if you don't like volatility.

Saturday, May 13, 2006


Another tough day and no real bounce at the close. We are critical now. The SOX (semi-conductor index) closed at the 200 day moving average and NDX (Nasdaq 100, see chart) closed right at the 2002 trendline support and the 2004 highs. I can't imagine this level breaking with the large amounts of puts sitting at QQQQ 40 and 41 going into option expiration week. Furthermore, QQQQ did manage to close above 2006 lows. It's tight and it's scary, but I also think the selling is way overdone and not in line with reality, which is a resilient economy that should see gas prices considerably ease in the coming weeks. If the fear is truly interest rates, than techs is the place to be, not the DOW or SPX. We should rally next week, up to QQQQ 41 and maybe higher. I am not sure we will be able to hit 42, my guess is 41.50. In any case, it's a good trade from here, but don't expect miracles and take your profits as they come. A strong move below the 2002 trendline support for NDX would be catastrophic for the markets and create panic selling the likes of which we have not seen since 1987. I doubt it will happen, but as usual, I must make you aware of where we are and what could happen. If we lose support, we could head to QQQQ 39.36 gap close from last November, which would be NQ 1611/1619.

Thursday, May 11, 2006

Overnight future's traders should keep an eye on NQ January open low of 1665 and see if it acts as resistance. 2006 lows are at 1652.50, not far from here.


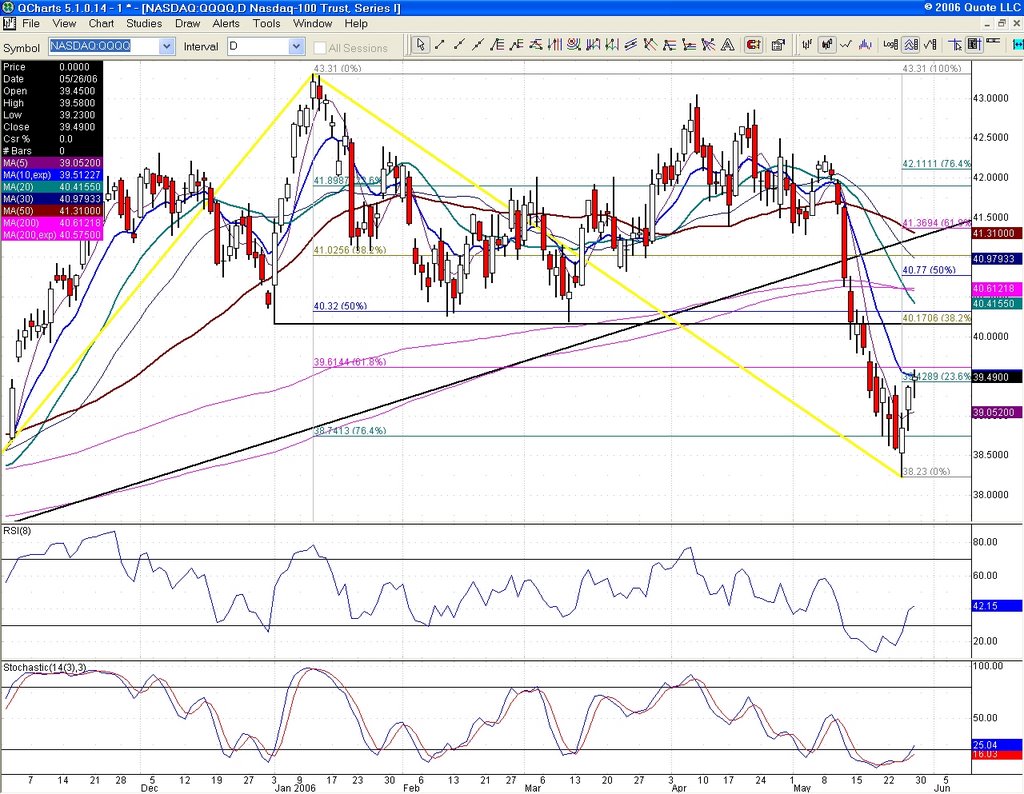
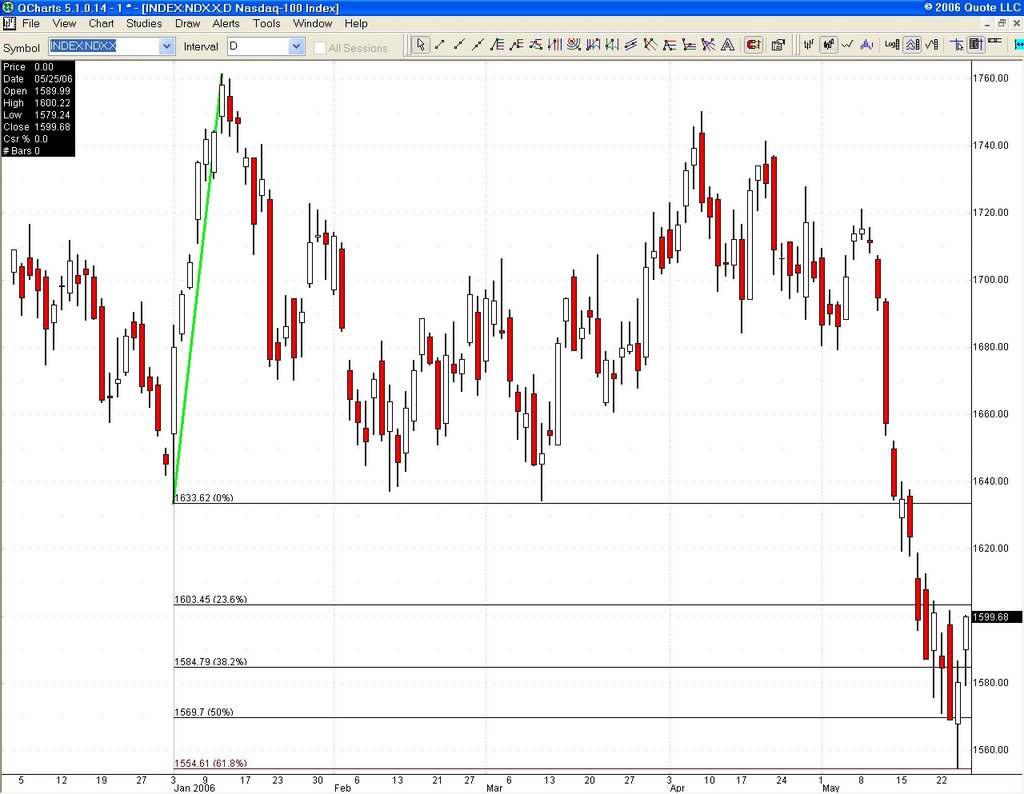
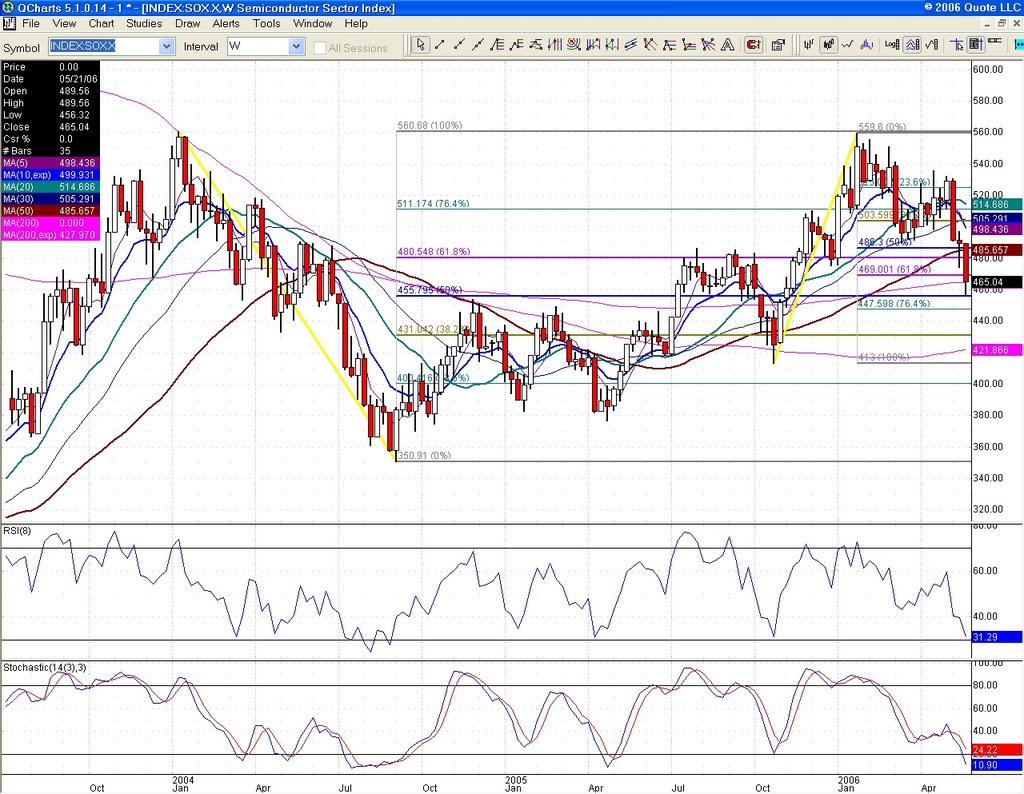
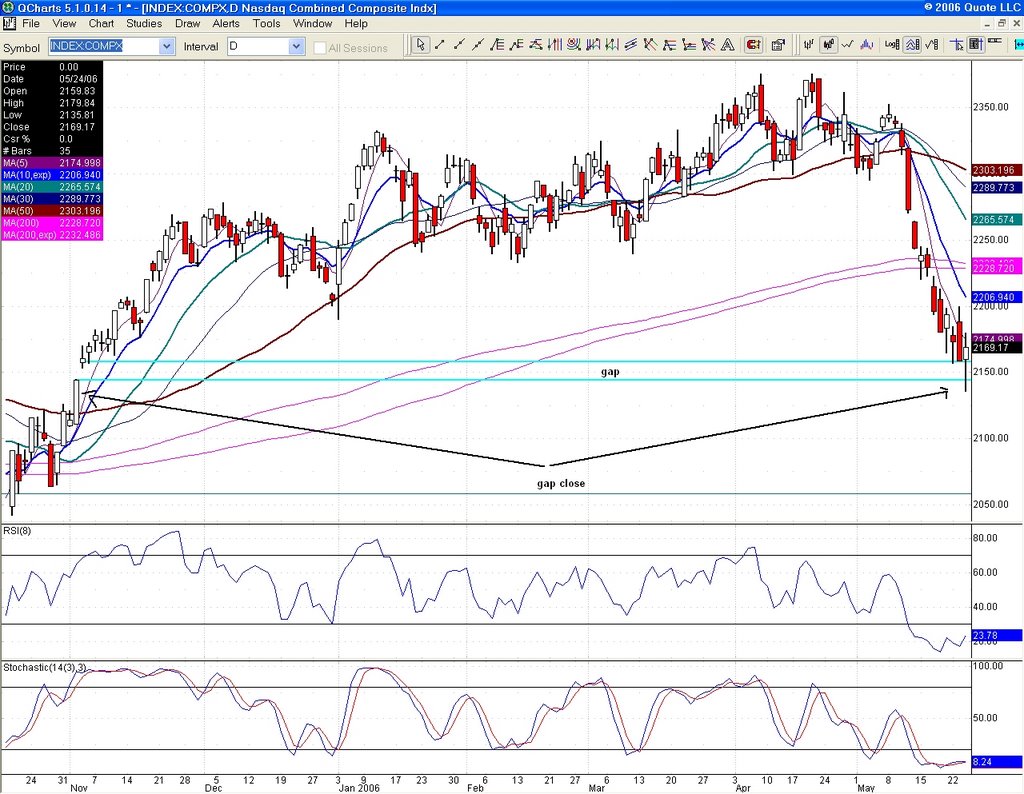
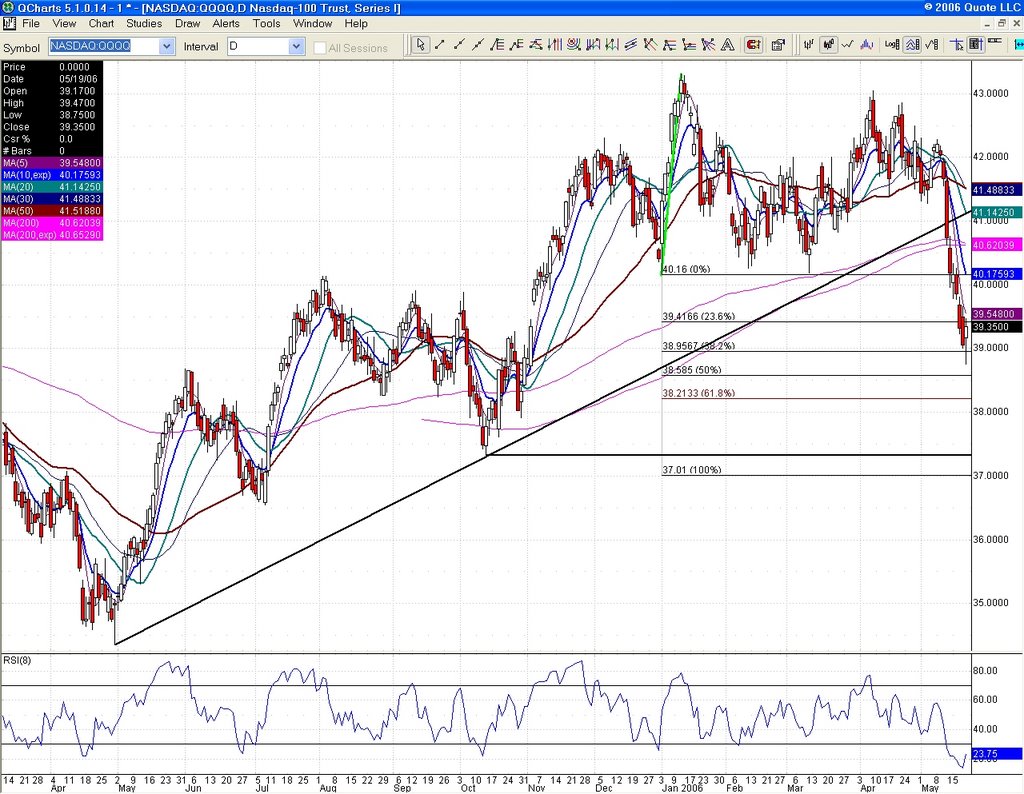
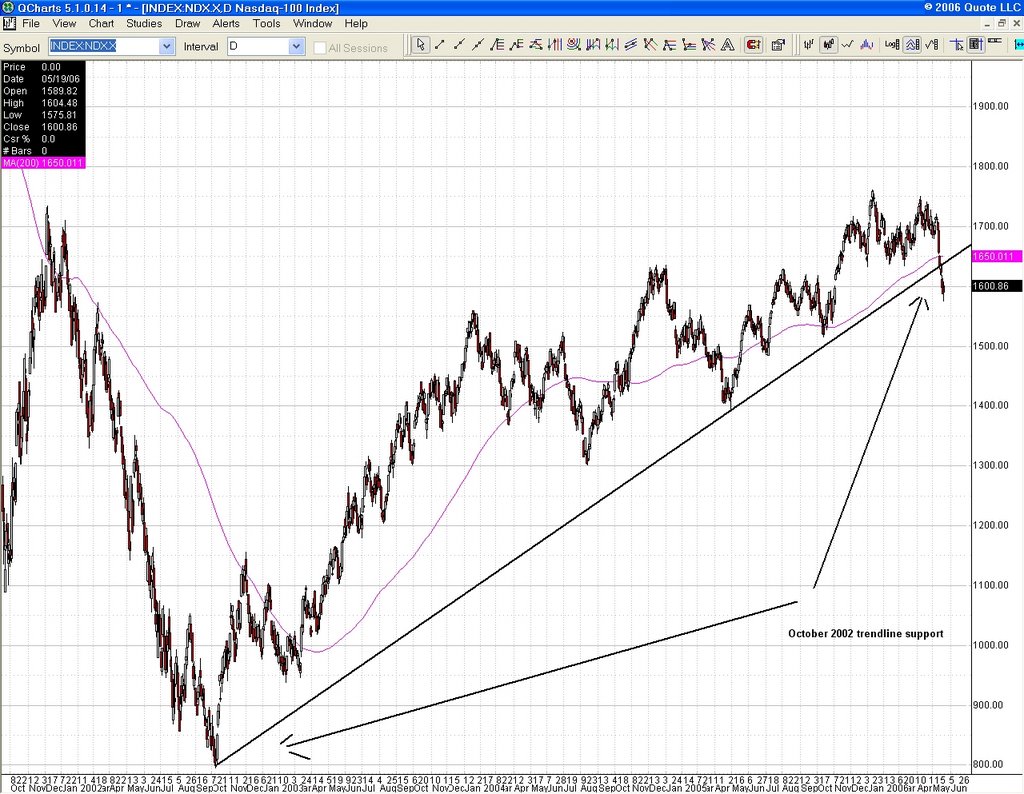
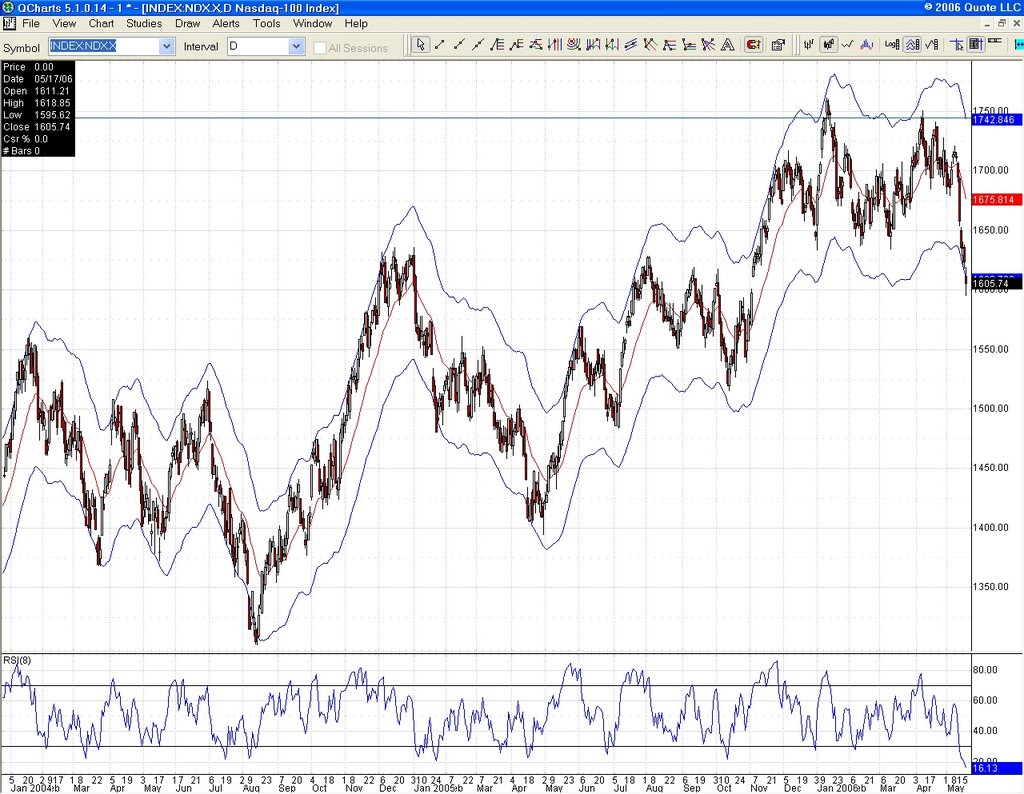
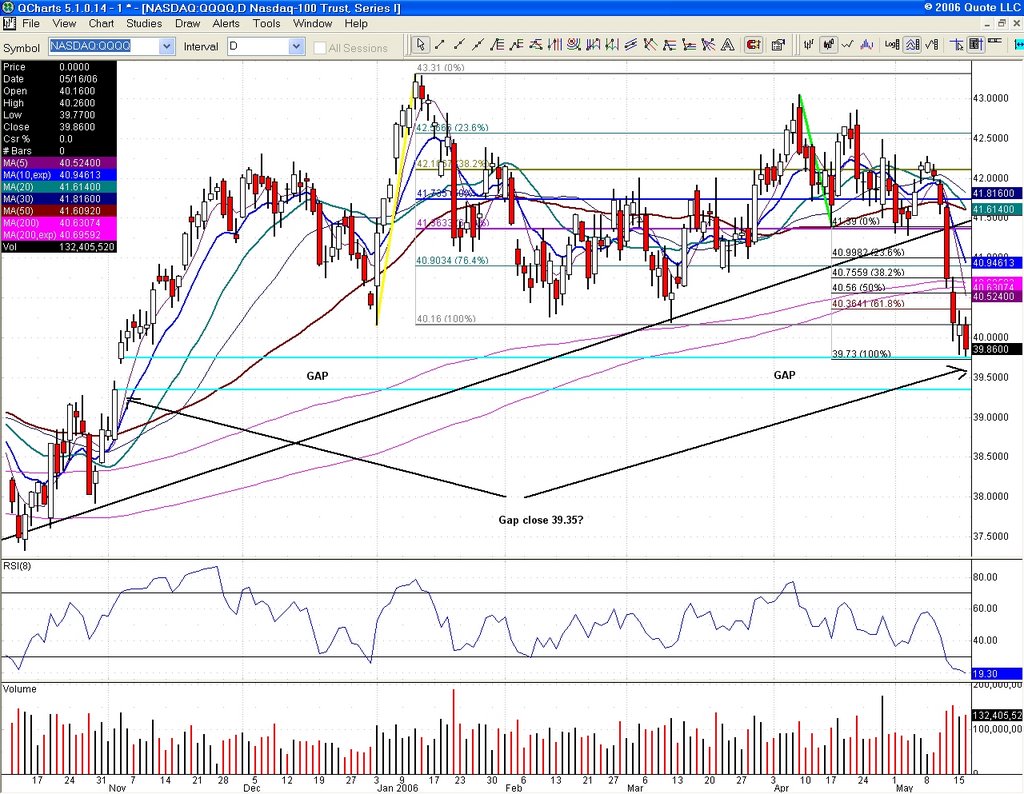
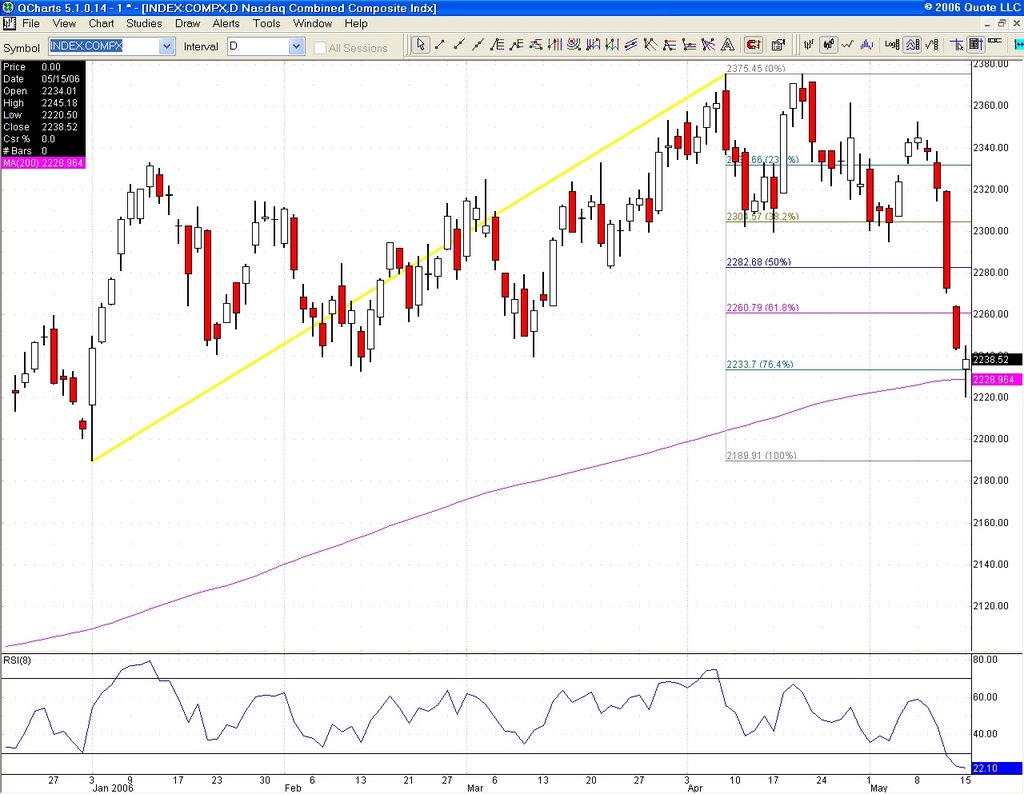
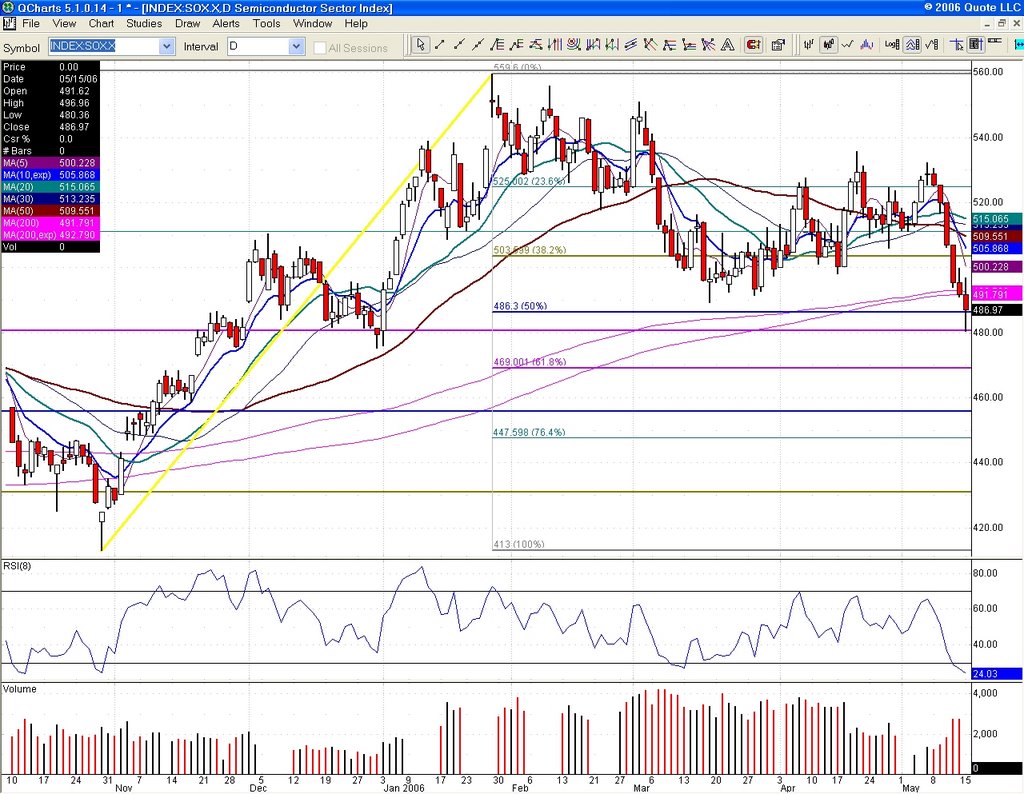
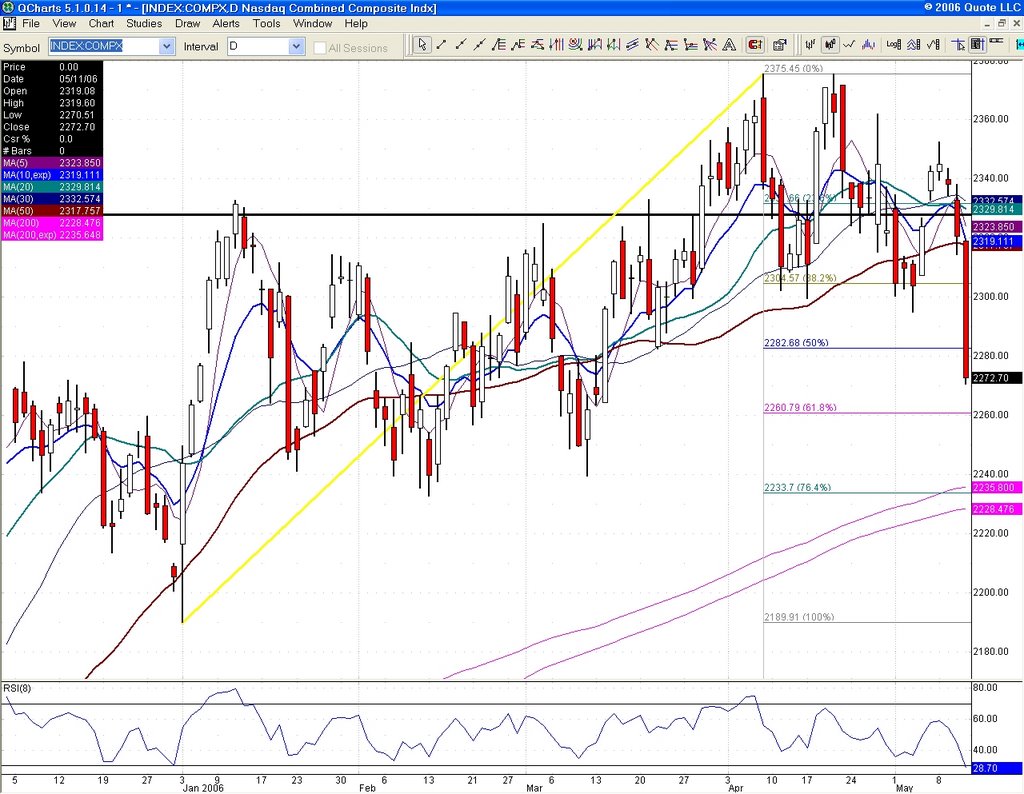
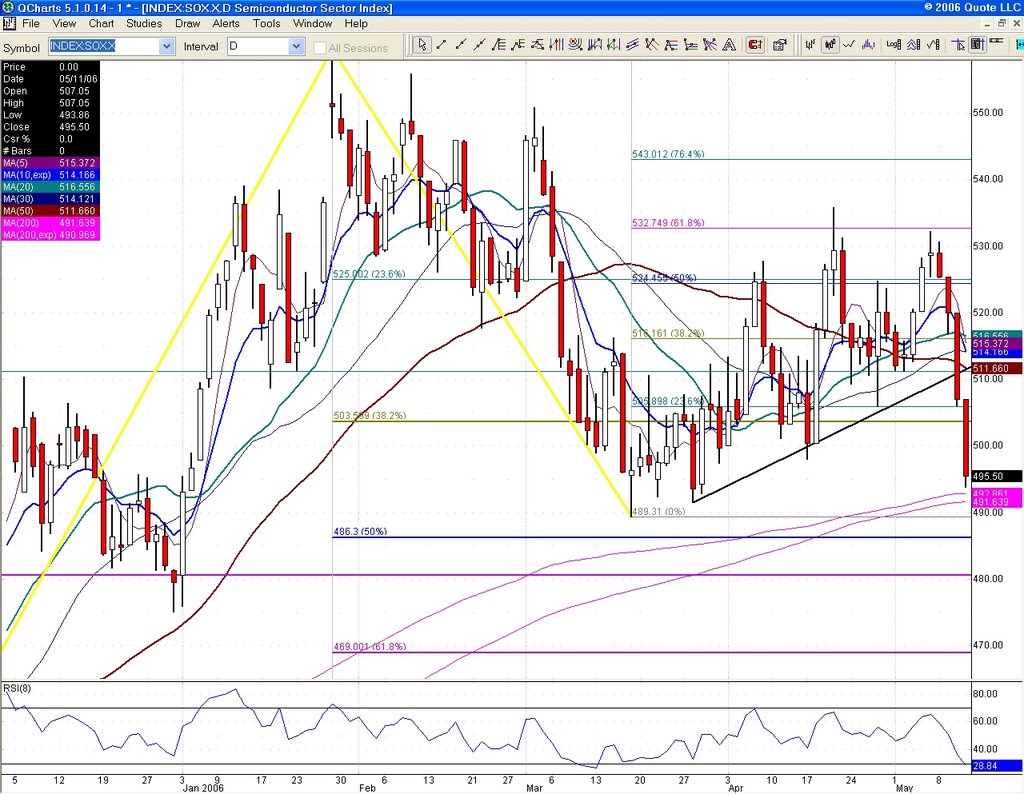
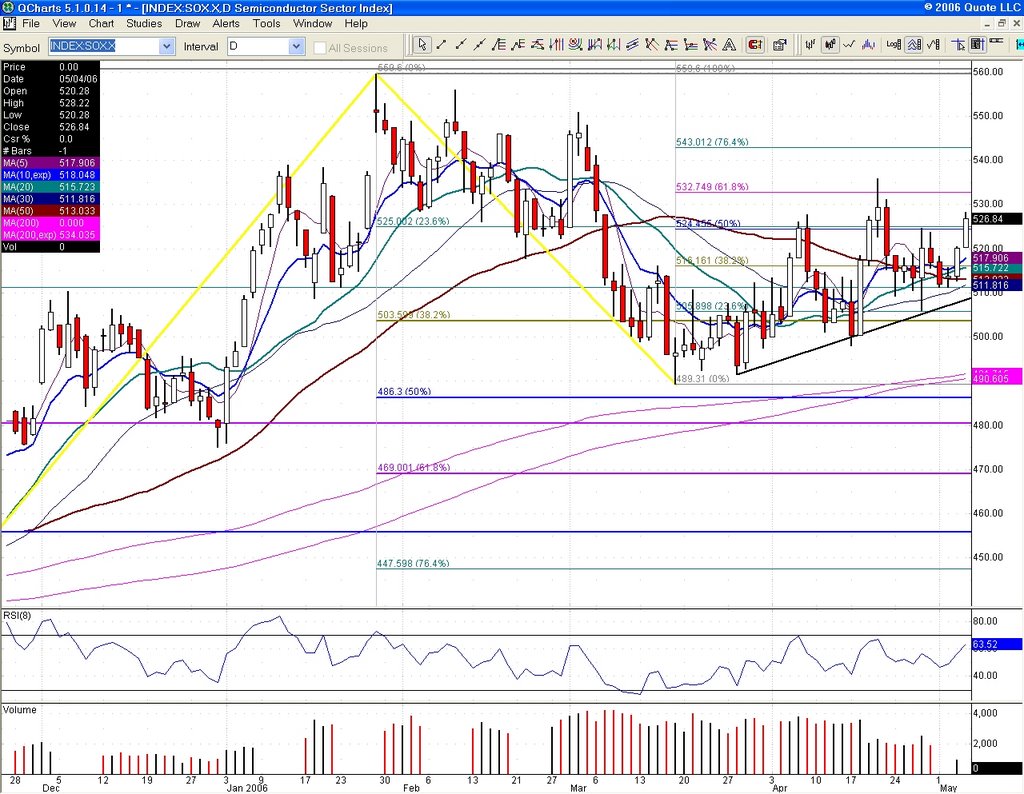
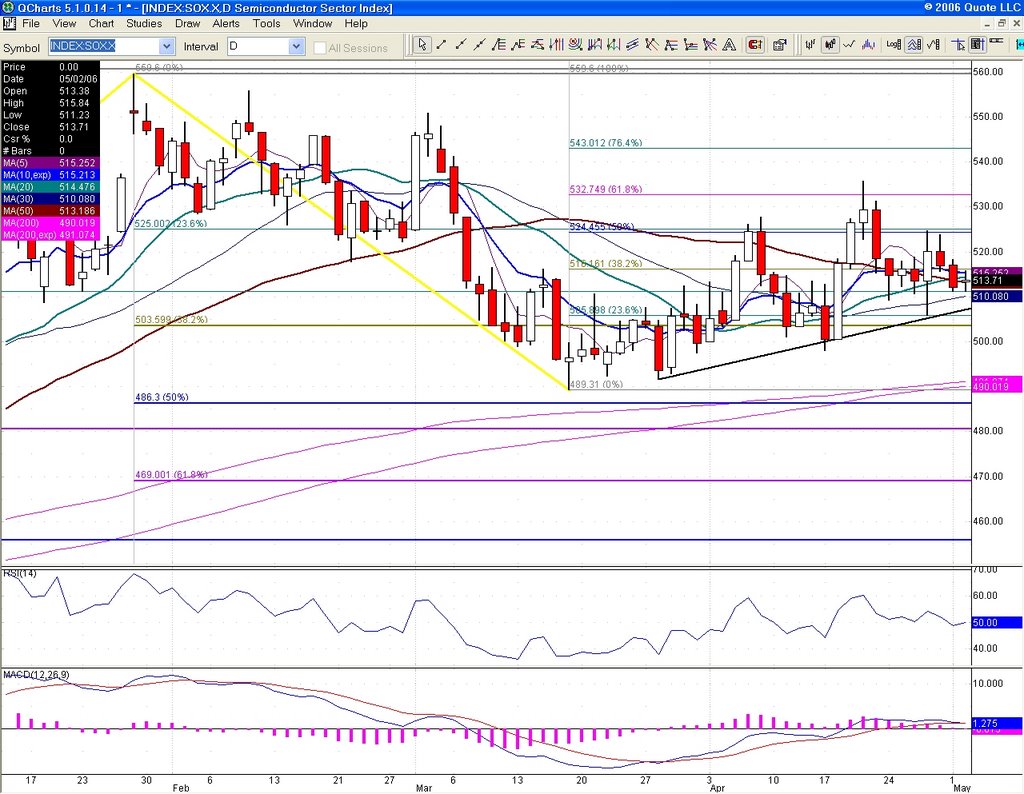
A very heavy day for the markets, especially techs. Where is the next support? Very close at this point. Let's turn to the SOX. 200 day moving average is at 491.64, we closed right above at 495.50. If we get one more flush tomorrow, expect that level (491.50) to produce at least a bounce. As for the COMP, we are fast approaching 61.8% 2006 support at 2260.79. Another level of support that should come into play. QQQQ bounced off of 200 dma, but it might be more accurate to look at NDX which has its 200 dma at 1650 (close was 1657.48).
I expect maybe one more push down and then we should rally next week, maybe even at the close tomorrow. The reason I think we will rally is because of the inordinate amount of puts sitting at QQQQ 41 May strike, set to expire next Friday. A staggering 5.1 put to call ratio with 400K puts to 87K calls. Understand that opex players will do everything, and I mean everything to pull us up above 41. Since we have a 1.20 pc ratio at the 42 strike, there is a very good chance the rally will take us up to 42 again. This is not set in stone of course, but I have learned over the years to never underestimate the power of option expiration week. After that, your guess is as good as mine.
Inflation fears, bla bla bla, all that talk is meaningless. Energy is a tax and will slow the economy, thus hampering any ability to raise prices to the point that gold hysterics are forecasting. In fact, I now see very good reasons for the Feds to stop right here. Oil should drop, setting the stage for a rally next week. That is my optimistic scenario. The worst case? Opex players can't control the selling and they have to cover their puts by going short, adding to the misery and possibly creating a crash. I doubt it, but I do have to make you aware of this before you go out and break the bank. I think we rally next week, but play it safe, please.
Link

Wednesday, May 10, 2006

SMH (Semi-conductor Holders) closing right above 50% 2004 high/ 2005 low. Note also the bounce off 50 weekly moving average. It doesn't get any more critical than this for techs.

Rough day for techs and NQ lost 50 dma support as well as monthly pivot. However, we had a modest bounce at weekly S2, usually a very suppportive zone going into an option expiration week. I have to emphasize once again the growing number of puts at QQQQ 42 strike and that is supportive of a rally. Whether it starts tomorrow or later is hard to tell at this point, but at least the Nasdaq held on to 50 dma support at 2318.
As for ES, solid bounce off that neckline I discussed last week and a close above weekly pivot keeps the bullish tone alive. There is nothing in the Fed language that strongly suggests any further tightening, in fact references to a slowing economy and housing market would make me interpret their actions as being somewhat open to the possibility of rate hikes stopping here. We shall see, but the action in bonds was not bearish at the close. It is very important to watch gold during these events and YG caught a bid, suggesting inflationary pressures are still on as far as bullion investors are concerned. This group is usually very savvy and they might be telling us the Feds are done, or are not overly hawkish. If they thought otherwise, gold would have been dumped.


To get a handle on how high gold/silver could go short term, I am using a fib projection chart for XAU (gold/silver index). The initial correction from January high is a place to start. This gives us a potential to 177.92, 61.8%. That would probably put the June gold contract around 735/750.

Tuesday, May 09, 2006
CSCO providing some after hours volatility. We will just concern ourselves with NQ (NDX futures) and what to expect going into tomorrow. Weekly pivot is at 1711.25, daily S2 at 1712, 50 dma at 1711.25, 38.2% retrace May H/L 1712.50: see a pattern? There is a price magnet in the zone between 1710 and 1712.50 which I would buy if hit. Of course, we have support at 10 day ema 1715, but since we lost the 20 dma after the close (1717.75), I expect some interesting swings. Place your bets, but buying NQ around 1712 with a stop at 1708 might be a trade worth looking into overnight. If 1715 holds, scratch that and hit it there. If you like to leg in, an initial long could be placed at 1716, stop 1714.75, just in case they never drive it down further, but with the Feds on tap, expect some hustle from the pits. A break below 1710 negates any bullish scenario.

As I suggested yesterday, waiting to buy QM/CL (oil) at 50 dma turned into a nice trade. Low was 68.25 and if you caught it be aware now of resistance at 71.30 and 72. I would tentatively start shorting 71.30, if stopped, go for 72, 20 dma.

Monday, May 08, 2006
I like to buy NQ (or sell)weekly pivots on an early test in the week and we could get that today as it coincides with daily s1 at 1711.25. It would also give us a test of 50 dma, now around 1710.75. The possibility of that pullback would be negated today if 20 dma at 1719 holds.
Oil (QM June contract) looks headed for 68.125. I would wait for that test to try a long there. With the drop in energy, an ES short between 1330 and 1334 can be considered. 1335 is a brick wall for today, but I would try entering earlier incrementally. Just be aware that the drop in oil is more bullish in the end for stocks, regardless of energy components.

Sunday, May 07, 2006
Start looking at your option chains and prepare the groundwork for your trades going into the week of the 15th. Usually, by Thursday of the preceding week (this Thursday), we start trading opex strategies. QQQQ has severe call resistance at 43 with some put support at 42 and even stronger support at 41. Pretty much the same picture as last month, so unless we have a major breakout, play the range.
On the index futures side, look at NQ 20 dma support which is confluence of pivot 1718/1719 for intraday support tomorrow. There is an interesting confluence between daily S1 at 1711.25 and weekly pivot at 1711.25. Could be a play, right above 50 dma. ES needs to hold neckline breakout discussed last week around 1320, which is 2 points below its weekly pivot (1322.50).

Friday, May 05, 2006

Nice rally, especially for ES and YM. NQ managed a close right at the 20 day moving average. The jury is still out whether or not this is within the bear flag pattern we have had since the April high. Bulls need to see a break and close above 1727.50. Bears want to see a failure right here. My bet is still with the bulls as long as the SOX holds 525. As for ES, we have a clean break above the inverse head and shoulder neckline (see yesterday's post) and should 1320 hold on subsequent pullbacks, there is upside potential to 1350. That could take a while, but keep in mind that the DOW is now within spitting distance of its all time high. Fed fear should creep in on Monday, play the range.

Thursday, May 04, 2006

Reverse Head and Shoulder on the ES daily chart. Bodes well for bulls on a volume break above 1318/1320.


SOX (Semi-Conductor index) was green yesterday during the sell-off and that was your clue to get on board. Remember that I had written about QQQQ having strong put support at 41, well this rally was a given once we got close enough. Today, the SOX upped the ante by closing above a key level, 524.45, 50% of 2006 which is also confluence of 23.6% October rally. Very bullish if we can hold above and a clear sign that rotation is back into techs.
Oil could not get a handle on 75 and the selling was swift, especially when it lost 73.05, 50%. Traders who were waiting for a breakdown definitely pounced on that level being lost. Nearby resistance is 70.80 and if we can't get a close above that soon, 50 dma at 68 is next. But don't count oil bulls out completely, they might try a push to 71.85/72, which I would gladly short.

Tuesday, May 02, 2006

Oil is in the news and it shows on the chart (CL 60mn). Stair-steppping the upper Bollinger bands as we attempt to make new highs. At this point, I like to look at Fibonnacci projections should we eclipse the April high of 75.35. Using as a high 75.35 and a low the recent V bottom pullback to 70.75, we get a better idea where this is headed should a stampede of short-covering/stop-run push occur above 75.35. My guess is right up to 78.20, 61.8%, but oil bulls would be very happy with 50% at 77.65. Key support is now 73.60 and 73.05. Frankly, I think the bad news is already priced in, but many have lost that bet recently. Be sensible and wait for a breakdown if you must go short. Cowboys can attack bounces after any failure below 75.35, but use tight stops. Should we break above 75.35, don't argue, fasten your seatbelts and enjoy the ride. Your disbelief is shared by thousands of rookie traders who feed the beast by shorting it.


SOX closed right above 50 day moving average, but it is looking mighty precarious. I still think we could have a bullish resolution this month, especially with all those QQQQ puts sitting at 41 and 42, but we could get one more swing low should the semis not hold up. Keep an eye on SOX 513 and below that, trendline support at 507/508.