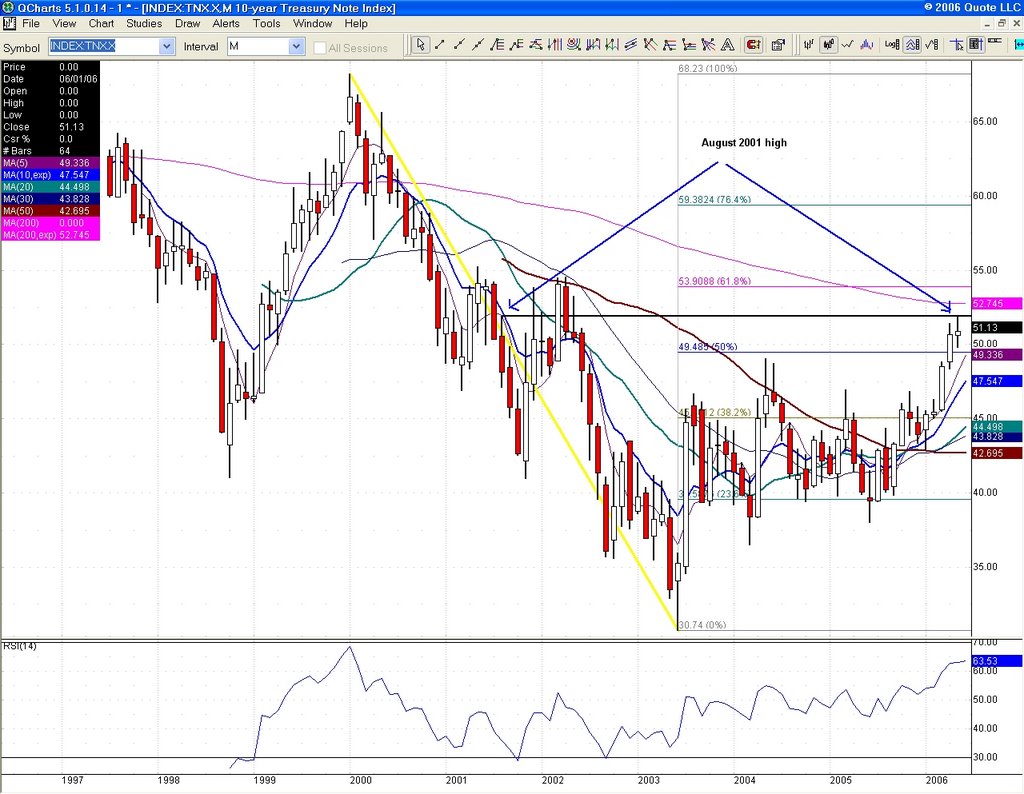
The monthly chart of TNX (ten year note) shows that we topped out in May at August 2001 high (51.92, or 5.19%). A push above sets up 61.8% 2000/2002 at 53.91. Keep a close eye on May highs.
This entry was posted
on Wednesday, May 31, 2006 at 10:50 PM.