AheadoftheNews Blog

A blog on market moving news and futures trades.

Sunday, July 31, 2005
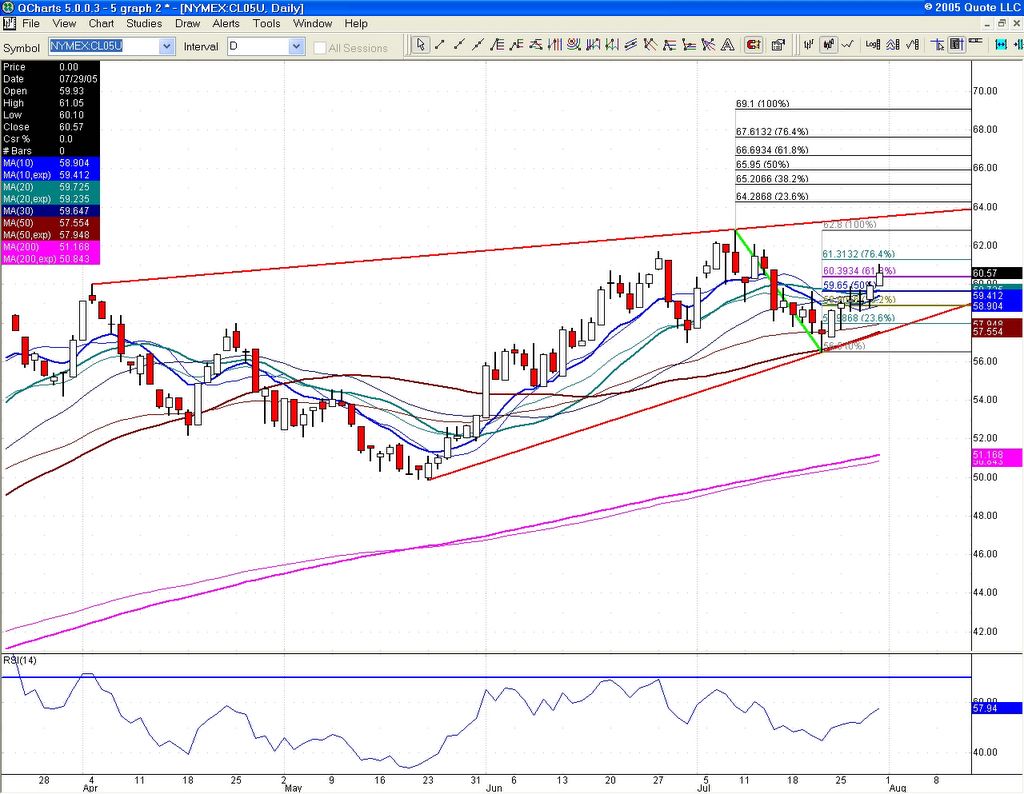
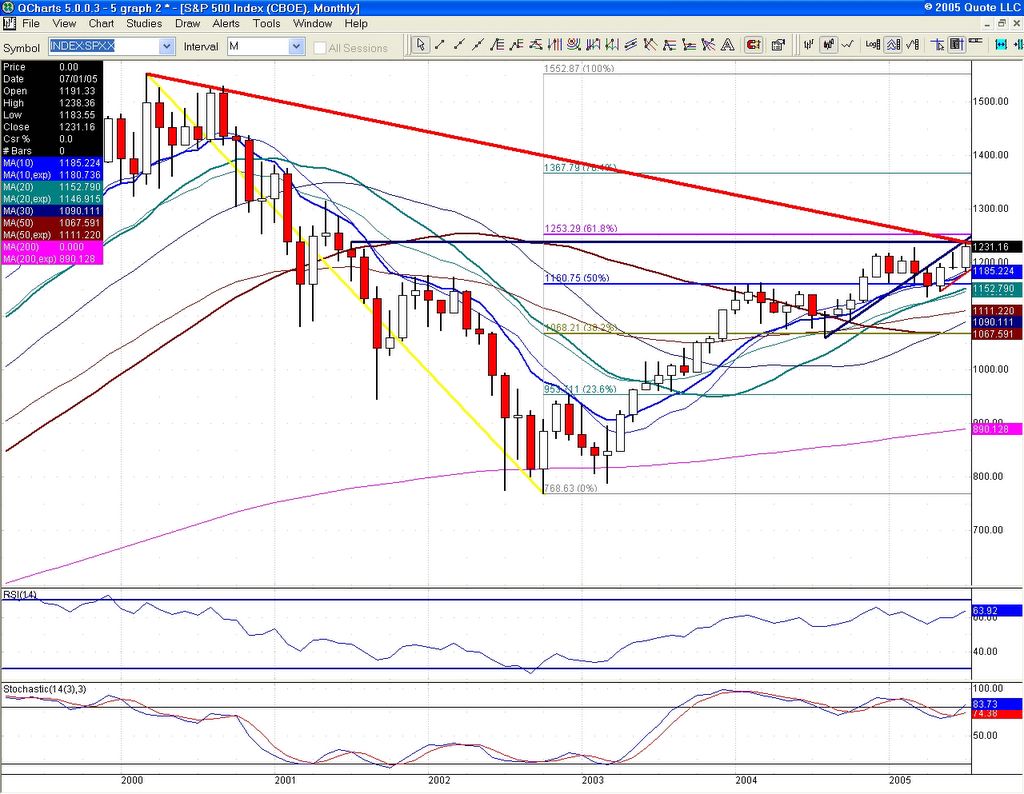
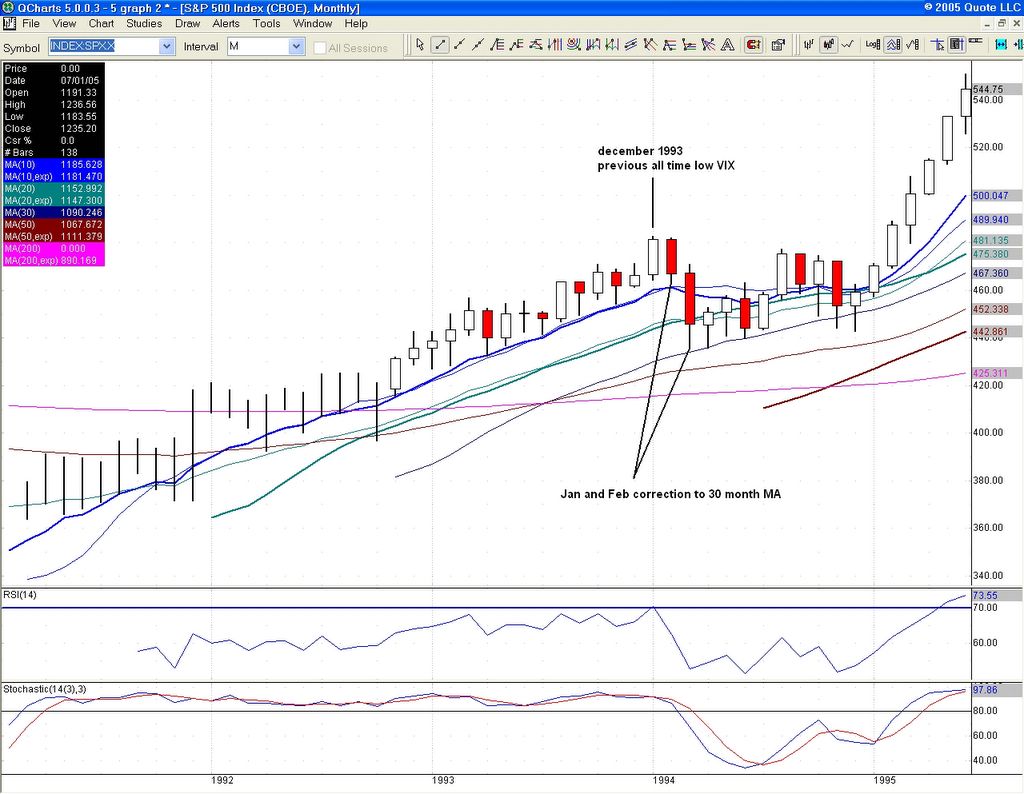
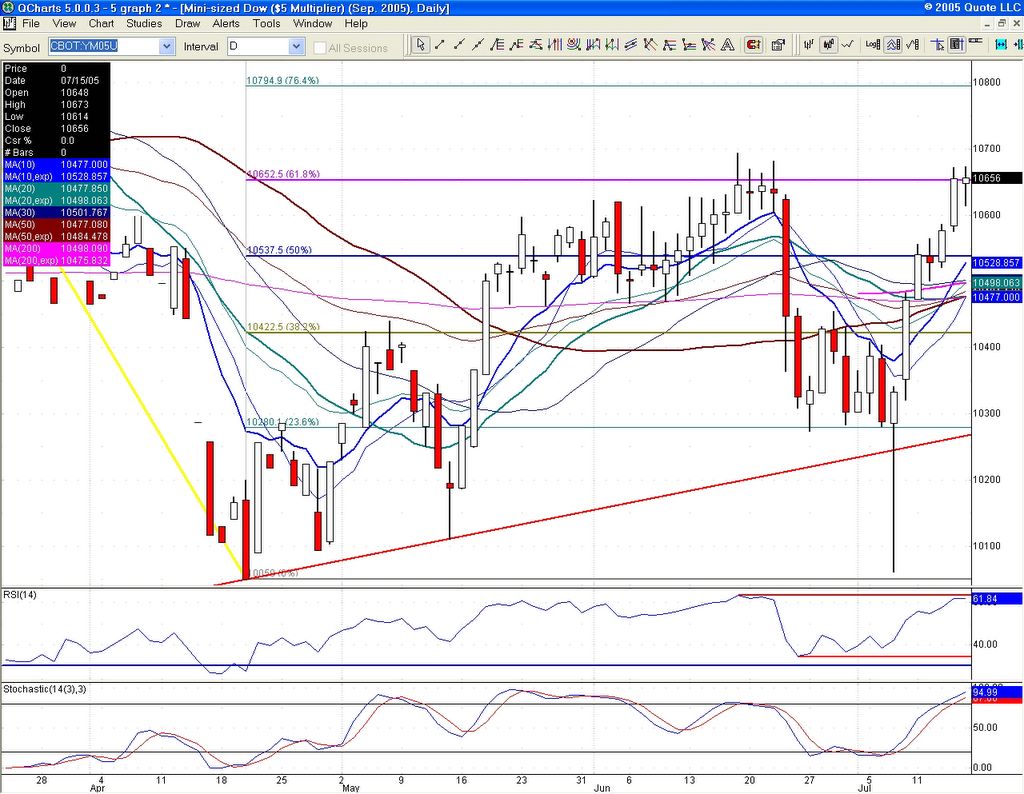
Some analyst at a famous web site just published an article on the VIX and how the single digit hit back in 1994 started the bull. Well, first of all it was also hit in December 1993 (even lower) and secondly, he fails to mention that SPX dropped a whopping 10% within two months (January to March 1994), before starting the slow build into a new bull. That would be a 120 point SPX drop by October. Not likely, but even half of that would be troubling. There is plenty to worry about for stocks near term: attractive yields emerging, higher oil and not a bear to be seen. Meanwhile, I stay bullish on oil and try to get in on the short of the year in stocks. It could be sweet. Might be a couple more weeks, or we have it now.

Upon further chart review, lowering the stop on QM (September crude) long back to 58.625. locking in +2.


We are in a rising wedge, but there is plenty of room still. 23.6% projection from July is 64.275, and right around trendline resistance. That is the new longer term target for August, but bear in mind that should we break above 64, the target moves to 65.20. There is pullback risk now after this bounce, and support below 59.65 is 10 day ema at 59.40 and 38% at 58.90. This trade might be exited anytime intraday should potential real weakness appear on the horizon.

click on chart for full size

Friday, July 29, 2005
QM (September crude) long from 56.625, raise stop to 59.325, lock in +2.7 ($1350 per contract).
Now trading at 60.35. 50% is at 59.65 and 10 day ema at 59.40. The stop is right below both with a little room for volatility. I want to ride this to all time highs. If we close above 60.40, it will be very possible.

Thursday, July 28, 2005
Here is a 15 mn chart of YM. We have a rising wedge coupled with a bearish RSI divergence (14 period to smooth out). I also have two sets of fib projections: the one from yesterday, which is 100% at 10728, thus stays on the chart since the high so far is 10626, and the projection from today which has 23.6% at 10745 and 38.2 at 10756. Given that we have a convergence of gap close from March, weekly R1 and 38% projection right there at 10754, I would expect that level to be sold. I know the long side is tempting, but frankly, this is not the time to throw in the towel. I much prefer being long oil.

click on chart for full size

The QM (September crude futures) trade is doing gangbusters now. We are +$1750 per contract (+3.5) and have moved above 59.65, the 50% marker. Long at 56.625, stop remains at 58.625 for now.

Raising the stop on the YM 10716 short to 10765.
10755 will be DOW March gap close equivalent and 10754 is weekly R1. 10760 is also previous high, and they might tag it, so adding 5 points for safety. I might adjust, but for now this is the setup. If you are not short, you can enter an order at 10750, stop 10770.

QM long from 56.625, raise stop to 58.625, lock in +2.
Protecting profits is the name of the game now.

Wednesday, July 27, 2005
Techs woke up late in the session, but SOX still faces stiff resistance between 477 and 480.50 (see previous charts). Watch NQ (NDX futures) 1621 and 38.2% fib projection off June for any sign of a breakout. Monthly R2 is 1618.
YM (DOW futures) sitting right below 10653, 61.8% 2005. Short from 10716, stop stays at 10736 for now.

QM (September crude futures) long from 56.625 move stop to 58.425.
Locking in $900 per contract. 58.65 should be support. Target is 60.35, should we manage to stay above 59.65.

Tuesday, July 26, 2005
SPX monthly chart. Powerful resistance at 1241: descending trendline resistance from March 2000, July 2001 highs and ascending ex-trendline suppport from 2004. ES has already hit that target pre-open last Thursday, it now remains to be seen if the cash index will do so as well. In any case, bulls need a close above 1241, or else bears will start getting more aggressive.

click on chart for full size

Raising the stop on QM long to 57.25, locking in +.625.
We were up over 3 points today, that's $1500 per contract, (300 YM points or 30 ES points) in two days. Not bad, but I think there could be more to come. Inventories are up tomorrow and will dictate trade everywhere. YM short from 10716 is over 100 points in profit and that one I will let ride as well. Stay tuned for any changes.

Monday, July 25, 2005
Raising the stop on QM long (September crude) to 56.625 for break-even. We are +2.5 on the trade ($1250 per contract) and holding up well.

Friday, July 22, 2005
SOX (semi-conductor index). Long upper shadow and selling pressure at 480, 61.8% 2004 high/ low. Techs are tired.

click on chart for full size

OSX (oil services) index. Money is flowing back into energy stocks and out of techs.

click on chart for full size

Thursday, July 21, 2005
QM (September crude) long 56.625, lower stop to 56.275.
Oil is priced in dollars. The Yuan revaluation should boost oil imports for China. I'm lowering the stop just a little to ride out the noise. QM now trading at 57.40, so we already have a nice cushion.

Some pretty significant chart events occurred today in the futures markets, prior to open of regular trade. Of course, we had another attack in London. But YM (DOW futures) hit a high of 10760 before selling off rather rapidly. Those of you who follow my blog and columns elsewhere know that this is the gap close from March and a key number to sell off from. Secondly, ES (SPX futures) tagged a high of 1246, right at 61.8% fib projection from June (see chart). Coincidence? You be the judge. In any case, it warrants taking aggressive short positions from now on. Wall Street heads to the Hamptons soon, and no one wants to be left holding the bag while the market cools off.

click on chart for full size

Raising the stop on the 10716 YM short to 10736.
We have Daily R1 at 10726 and weekly R1 at 10728 and tomorrow could be volatile.

Weekly chart of SOX. Notice the levels we hit and that is pretty toppy: 477.77 is 23.6% 2002/2004 and 480 is 61.8% 2004. The end of that party for now.

click on chart for full size

QM (September crude) long from 56.625, raising stop to 56.575. Minimal risk now.

Shorted YM (DOW futures) at 10716, stop 10735.

Long QM (September crude) at 56.625, stop 56.475.

Wednesday, July 20, 2005
Blast from the past: SPX end of 1993 previous all time VIX low and subsequent two month steep correction in equities (these are monthly candles)

click on chart for full size

VXO (S&P 100 option volatility index), if you take out what looks like a bad tick last week, has now hit an all time low, if you use it as old VIX. This means that ever since options started trading, we have never seen such low premiums.

Stopped out for even on the oil trade. We are flat for now. The drop in oil created a nice bit of short covering and that DOW March gap at 10750 is getting closer.

Rolled over the QM (oil) trade into September contract. We have a profit of .85 ($425 per contract). Our new entry is 58.30. Currently, September is trading at 59.35. Raising stop to 58.30 for break-even.

Tuesday, July 19, 2005
YM 10576 is 61.8% projection from Tuesday and gap close from last week as well. That should be a minimum target for a short tomorrow, if 10617 breaks. I'm hoping for some kind of overnight bounce to short ahead of Greenspan, who should make it clear he is staying the course on raising rates.

We have somewhat of a tech wreck after-hours. Intel and Yahoo getting clobbered and I wish I was still short. Definitely hit any bounce with a short tomorrow. Bullish sentiment is at all time highs and if you are long, you should start protecting your profits.

QM (August oil e-mini futures) long from 57, raise stop to 56.60.
Now trading at 57.59 and looking like it is ready to start a new leg up.

They managed to psych a few shorts out and we got stopped at 10675 with a high of 10683. After hours, we are back at 10627, so that is a shame. The QM (oil) long is alive and well, with solid support at 50 day ema (56.83). I will raise the stop.

Monday, July 18, 2005
Short 10661, buy to close at 10555, stop 10675. Lower the stop to break-even on a trade of 10580.

Long QM (Aug oil) at 57, stop 56.45.

Friday, July 15, 2005
Considered lowering the stop on YM short to break-even, but decided to stay in the trade with the stop at 10675. Option expiration Fridays are hard to gauge, but there seems to be a hint of weakness, visible in the upper shadows of the daily candles, almost the same pattern as June top. Frankly, I think we are going higher, but I'm betting we close the gap below first. I'll hold the trade over the weekend, see what Sunday night gives.

click on chart for full size

Thursday, July 14, 2005
Voice of reason in the midst of the screaming pump and dump crowd:
Merrill sees slower economic growth
Oil, higher rates and U.S. dollar will weigh on rest of 2005
Link

NYSE Ad/dec impressive drop from highs.

click on chart for full size

Inititiated a tentative first short, YM (DOW futures) 10661, stop 10675. NYSE Advance decline lines went from +1600 to -493. Very strange and not to be ignored. 10654 is also 61.8% 2005 and does not look very supportive

Wednesday, July 13, 2005
Back on May 28th, I profiled a possible move of the DOW to 10750 to close the gap from March. It seems we are on track to hit that number, even though postive sentiment extreme at this point requires some pulling back. I'm inclined to take a short at YM 10616 (DOW 10600 or so)if it fails there, pick up a few points, then switch to long up to the gap close. After that, bearish bias returns, as GDP numbers from June will show a decline thanks to higher oil.

YM (DOW futures) back on a roll, after lagging the techs. Resistance ahead at 10616. Oil dropped and let's see what bulls have left.

click on chart for full size

Tuesday, July 12, 2005
The only future I want to be long is oil. The froth keeps building sentiment-wise in the equities market and I'd rather chase oil, with all the disbelievers still feeding more upside there. Steady as she goes. Upside risk is now 65.88.

click on chart for full size

Monday, July 11, 2005
Today, we look at QQQQ. Sitting right below descending trendline resistance from December high and 61.8% retrace. We are right at an important crossroad. Sentiment is so overly optimistic, I remain skeptical of any further sustained advances.

click on chart for full size

Friday, July 08, 2005
Bulls are back with an amazing recovery. DOW closed right at the 200 DMA, and YM above the 20 dma. COMP is now above 2100 and NDX closed at the top of the downward channel, but still in it. Monday will depend on oil and Hurricane Dennis. The DOW needs to hold 10450. Earnings and option expiration week are on the plate as well, a very volatile combination.

Stopped out YM short +0.

Exited QM long at 61.50, for +2.325 profit ($1162.50 per contract). Let's not get greedy.

QM (oil futures) long at 59.175, raise stop to 60.175, lock in +1. Now trading at 61.60. My fib projections have wide targets ranging from 62.40 to 64, so take your pick.

Thursday, July 07, 2005
QM (oil) bidding above 61 overnight. Trade is +2 ($1000 per contract). Dennis should keep upside risk in place.

QM (oil futures) long 59.175, raise stop to 59.175, even.

Long QM (August e-mini crude futures) 59.175, stop 58.85. Buying the 10 day sma. Should be strong support.

YM (DOW futures) gap is closed at 10288. Resistance has moved up to 10296 and 10303. Oil has taken a hit on fears of an economic slowdown and jet fuel use. However, gasoline inventories were down and if people opt for car travel instead, I'm not sure we are out of the woods with high gas prices.

Big initial drop from the terrorist attack in London. Overnight YM futures tested April lows and bounced back. Gap close is 10288.

YM short at 10395, lowering stop to 10395, even.

Wednesday, July 06, 2005
Yesterday's rally fell apart for the DOW. Sentiment is still bullish, while we keep dropping. That is not a good sign. Our trade is now 120 point in the black and I think there is more to come. Uptrend support from April lows sits at YM 10250 and we should be paying it a visit soon. If that breaks, April lows are right around the corner. It will all depend on oil, but my target there is 65, so we have more room.

click on chart for full size

Sentiment

Tuesday, July 05, 2005
Last week had the lowest reading of bearish advisors since late December, when everyone was telling you there would be a Januray follow-through. Bullish sentiment in the face of deteriorating technicals is a red flag. We could rally further, especially if oil drops, but I'm not sure any bounce will have lasting power. Bulls have the ball, let's see if they fumble again. This chart tells it all (courtesy of www.vtoreport.com):
Link

Shorted YM at 10395, stop 10425.

Friday, July 01, 2005
Oil is back, closing at 58.75. Resistance is 61 and support is at 56.40. Markets are going to zero in on every CL/QM tick until earnings take center stage. There are some optimistic consumer confidence readings, but that is a lagging indicator and polled before the resumption of the oil rally. NDX closed again below the 200 day ema and SPX has lost 1200. Expect a bounce after the holiday if there are no major events, but the mantra is still short the rallies until proven otherwise. Rising rates and rising oil are not a good combination for stocks, no matter what the pundits say. And since they are all mostly bullish, we stay bearish.

click on chart for full size