AheadoftheNews Blog

A blog on market moving news and futures trades.

Monday, October 31, 2005

Let's look at oil, which is on a slippery slope, but don't count it out, or expect some kind of bear market. The winter is approaching and heating oil demand will rise once again. This chart shows the summer head and shoulder and the ensuing downward projection, around 58.85. We also have prior double bottom support around 58.10 below that and the descending trendline intersection. The 200 dma is not far at 57.60. I would be a long term buyer of oil in the area between 57.50 and 58.50. I am not sure 59 will hold as support in the next few days, so be a little careful and wait for the drop to low 58 zone.

DELL just warned and sent futures tumbling after the close.
10/31 - 04:08 PM ET Dell Sees Q3 Non-GAAP EPS Of $0.39, At Low End Of Prior Guidance

Sunday, October 30, 2005
Big bounce on Friday, sure feels like the fabled PPT (Plunge Protection Team) is hard at work. Everyone has decided the bottom is in and funds are scared they will miss the boat. But there was also some rotation going on and it seems it was out of techs. The SOX was lagging, although ended up above the 200 week moving average at 422. Watch that level very carefully next week. We could very well have a scenario where the DOW rallies and not QQQQ/NDX, just like in August of 2004. I am keeping the powder dry a little longer before buying the Q's. I have not changed my outlook for a bullish second week of November for techs, but the coming days could be a minefield. NQ (NDX futures) did a double top and critical failure at 1600 and that is not healthy.

Oct. 31 (Bloomberg) -- Wall Street's biggest bond-trading firms say Ben Bernanke will be as zealous in fighting inflation as Alan Greenspan when he takes over as chairman of the Federal Reserve on Feb. 1.

Fed policy makers will raise the bank's overnight lending rate at least 0.75 percentage point to 4.5 percent by mid-2006, said 17 of the 22 primary dealers of U.S. government securities. In August, only 12 said the rate would reach that level, according to a Bloomberg survey.

Banc of America Securities LLC, Citigroup Global Markets Inc., Lehman Brothers Inc. and Merrill Lynch & Co. this month raised their estimates for the so-called federal funds rate after the biggest jump in consumer prices in 25 years. Higher rates may mean a fourth year of bond returns below 4 percent and increased consumer interest payments.

``Bernanke's nomination does not change our outlook,'' said Lewis Alexander, chief economist at Citigroup in New York. ``The Fed has been hardening its rhetoric in response to emerging inflation risks. They are not ready to pause.''

Citigroup forecasts a 4.5 percent federal funds rate by June, an increase from its 4 percent estimate made in August. The firm expects the rate ultimately to reach 5 percent next year.

Thursday, October 27, 2005

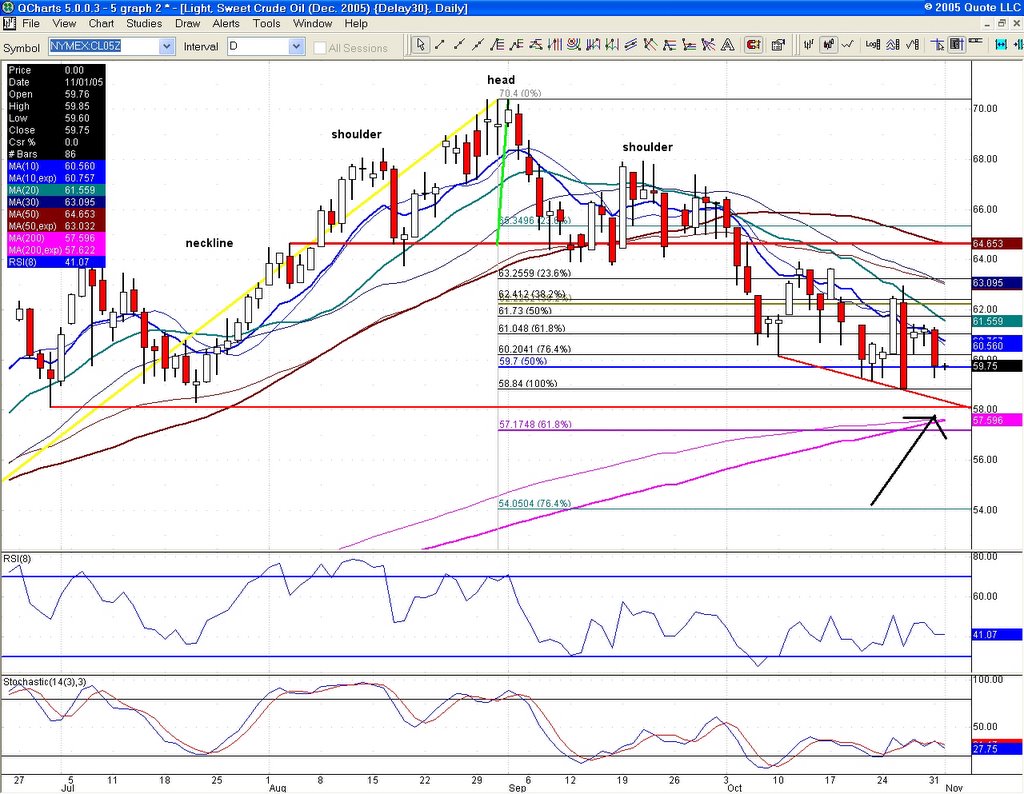
What a difference a day makes. Things are heating up, not only for Rove and company, but for the US stock market. The fear going into tomorrow is how the dollar will hold up. We could get a one two punch if GDP is lower than expected and indictments against senior White House officials are handed down. Remember that most market collapses are currency driven.
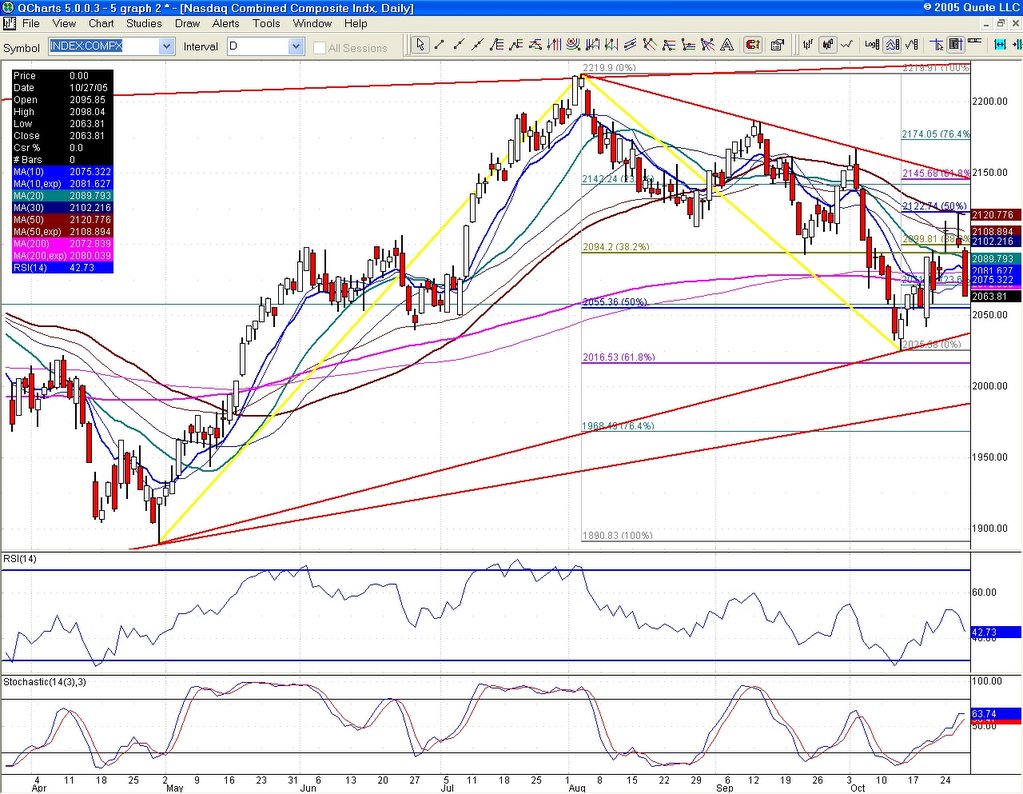
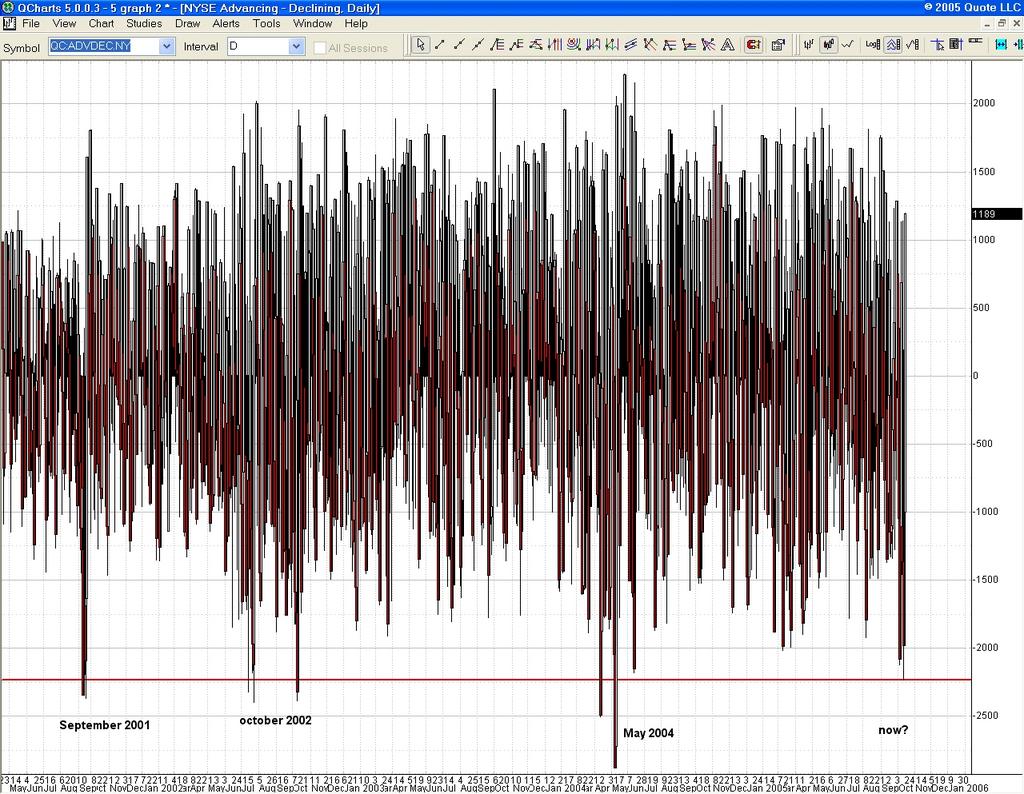
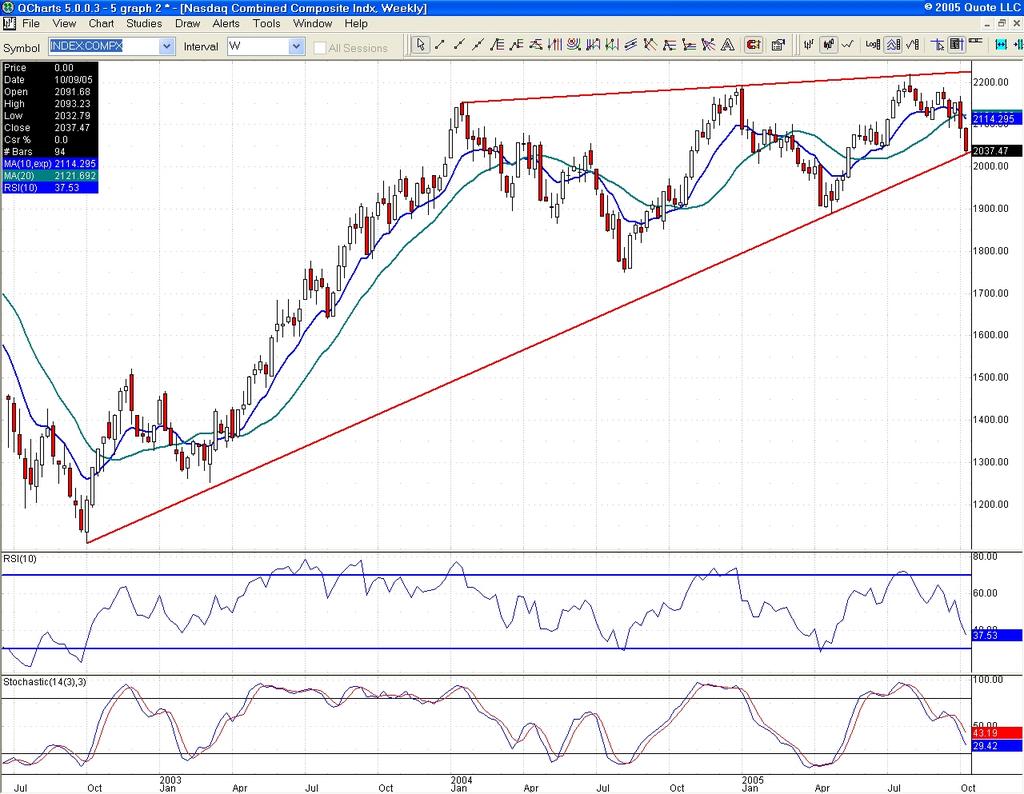
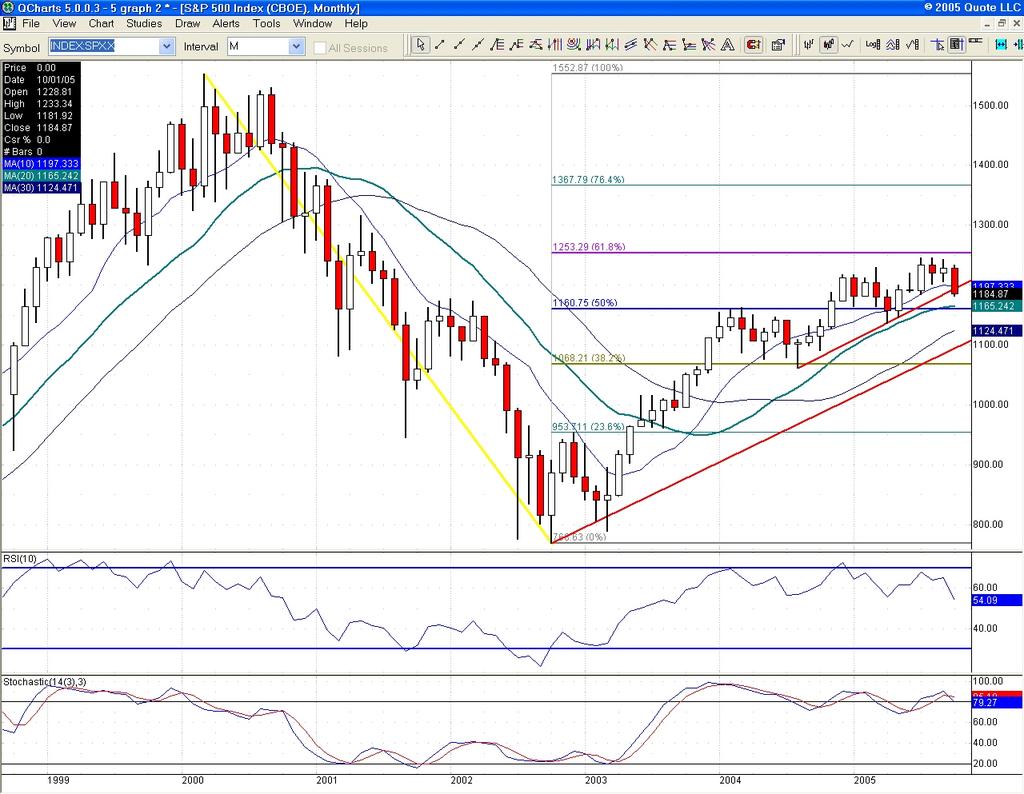
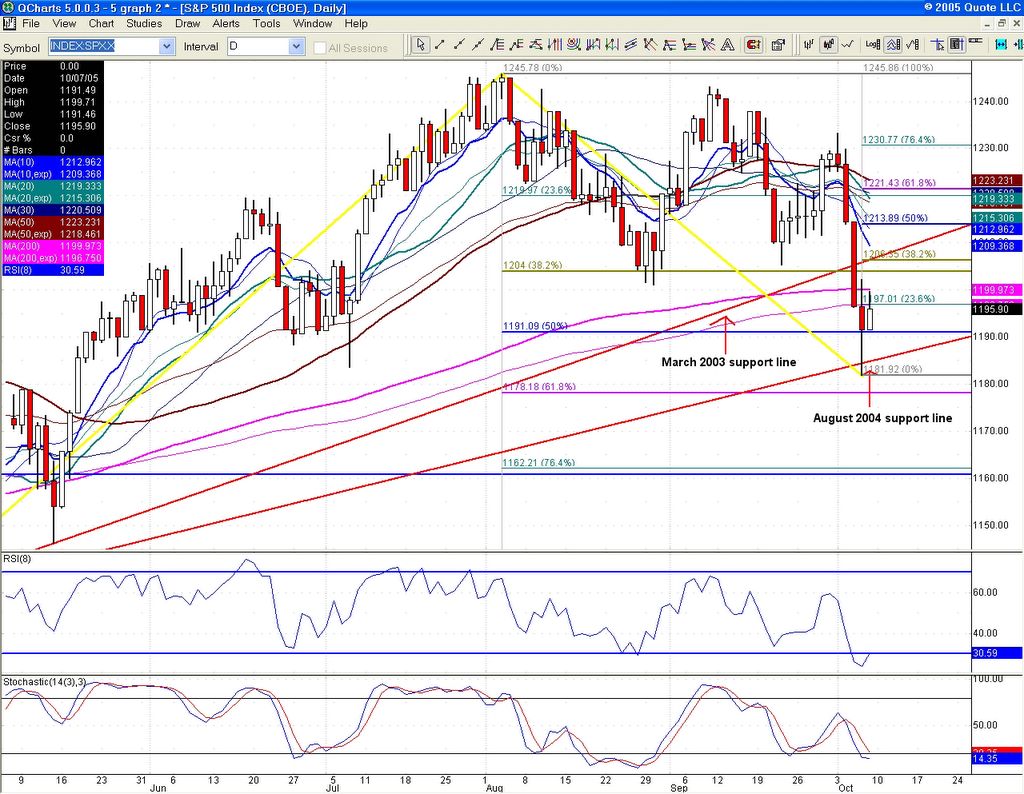
As far as the technical picture, it is looking bleak. We are definitely in a bear market. SPX tried a few times to hold above the 200 dma, but to no avail. The selling today was brutal. Even the COMP lost the 200 dma and that is bad news for bulls, especially since no near term catalysts, other than the calendar, exist. Microsoft missed and semis are getting clobbered.
If you do not know what you are doing, it is best to stay out of the markets the next day or so. This is not the time to play hero. I still expect a second week of November rally, but it could get a little scary tomorrow or Monday. Greenspan needs to soften his stance and announce that this is the last hike, or we are going to have a dismal fourth quarter. I for one can't wait until he leaves and his successor takes over. There are already rumors that Bernanke will be cutting rates. But January is far away.
The COMP must hold the 2055 area or we will be visiting 2000 very soon.

Tuesday, October 25, 2005
Funds usually do their buying into the close. This is the second day in a row they have been doing this, although today stayed in the red, but we bounced sharply off lows. A look at QQQQ p/c ratio for November 37 and 38 strikes shows extreme put open interest which translates into heavy pessimism. I would use any pullback to the 37/38 area as a buying opportunity. We could have some more backing and filling to do. Once we get going, we should rally all the way into Thanskgiving, at which point I would exit longs. December does not look so hot for now. There could be some major negatives in the consumer area this Christmas.

Monday, October 24, 2005

Big day for stocks, bad day for bonds. The Street is viewing the new Fed as a dove on inflation and that spooked bonds and cheered stocks. But let's not forget that we have three more rate hikes possible before the change of the guard. In any case, bulls have the ball. YM needs to close above 10415, October descending trendline resistance before they can claim the trend back. Click on chart.

Friday, October 21, 2005

December gold found support at 462, 38.2% August rally. It should produce a bounce, possibly up to 468. If 462 does not hold, next support is 459, 50 dma and 457, 50% and just above 455, August high and channel support. I expect a much larger bounce at these levels, possibly up to 472 or so. The bears need a close below 455 to claim any hope a new downward trend has started. For now, this is a pullback that will most likely find buyers, if not at least a healthy dose of short covering.

Thursday, October 20, 2005
Until SPX closes back above the 200 dma (1200), don't kid yourself, we are in a bear market. Let's see how the market handles the GOOG news, but bulls better get it together and fast. Option expiration week is adding extra volatility, making it hard to analyze the swings.

Stopped out -0.20 on QM long. Oil is on the process of finding a bottom and it could have just done that today at 59.65, which 50% May rally. The stop was tight and for good reason, these are volatile times.

Wednesday, October 19, 2005
Big bounce. Does this mean we found a bottom? Hard to tell since this is OPEX week, but bulls have the ball. The COMP has tremendous resistance between 2094 (38.2% April rally) and 2096.50. I will be watching that zone, along with the obvious SPX 200 dma, for any sign of failure or success.

Testing the waters on a QM long (December crude). We are right in the seasonal sweet spot for oil where bottoms are formed. The inventory numbers gave us a sell-off which failed to take out the previous lows and left us with a nice bullish RSI divergence.
Long QM in the overnight session at 61.10, stop 60.90.

Tuesday, October 18, 2005
It is officially short the rallies mode. Target is SPX 1160.75. If SPX 1160 fails to produce a bottom, we should be testing the 2005 lows for SPX in the next couple of weeks at 1136.

Greenspan made a big speech last night in Japan on energy, implying that inflation will not be the same problem as the oil driven one in the 70's. This data just in might contradict that statement.
Oct. 18 (Bloomberg) -- U.S. producer prices rose in September by the most in 15 years after Hurricane Katrina pushed oil and gas prices to record highs and drove up costs of other raw materials, a government report showed today.

The 1.9 percent increase in prices paid to factories, farmers and other producers followed a 0.6 percent increase in August, the Labor Department said today in Washington. The core measure, which excludes food and fuel, rose 0.3 percent after no change in August.

Monday, October 17, 2005
Exiting YM long at 10322 for +100. This Gulf storm could be serious business.

Sunday, October 16, 2005
YM long 10222, raising the stop to 10239.
Locking in +17 and placing the stop right below S1 at 10241 and 50% at 10246. The area between 10240 and 10246 is a must hold for bulls.

Friday, October 14, 2005

I am enjoying a nice long trade now, but I am far from certain that we are done exploring the downside. Further analysis of the NYSE advance/decline line shows that we could still move lower. A -2200 day has never been a single day event. Wednesday was a -2200 day, but not Thursday. It is good for a tradeable rally, but it might not be good enough to call a bottom. If we can move past the 10 day sma, the next hurdle will be the 20 day sma, which I plan on shorting on a failure (YM 10420, ES 1211). For now, stay long, just trail your stops. The put activity next week could hold the markets up and even give us a nice bear market rally, but SPX and DOW are still below their respective 200 dma's, so play it safe and don't throw everything at this rally. There could be a real doozy of a sell-off the last week of October. I would welcome it as it would set us up for a fantastic bull run which could finally take us out of the miserable trading range we have been stuck in for years. Don't forget: the Feds will stop raising one day and the markets will love it and eat it up.

Raising the stop on the YM 10222 long to 10212, just below gap close.

We should get a ride into next week that could take us to 10400. First step though is 10 day ema at 10326, that could meet some resistance today. ES longs should place stops at 1176. The longer term picture is not so rosy, but bear market rallies carry some punch. If Greenspan would just stop raising rates, we could say the worst is over. Doesn't look like he is about to do that quite yet.

The YM short was closed overnight at 10225 (+483) and a YM long was initiated at 10222, stop 10192.

Thursday, October 13, 2005
The action in tech today was bullish. The COMP managed a solid close back above the 2002 trendline support and SOX held on to its 200 dma. We had two back to back days of NYSE -2000 advance/decline issues (actually -1979 today, but that qualifies) and the only past two recent incidents of that occurring October 2002 and May 2004 marked a reversal point. Barring a catastrophic CPI read tomorrow, a temporary bottom could have been put in. Longer term, I am not confident about this market, but for now we might get a rally that could last into the end of next week. Keep in mind that tomorrow could be a very volatile session but there is a good chance that any bad news in the CPI report is already priced in. For next week, lots of put activity for OPEX (option expiration) and that is supportive.

Wednesday, October 12, 2005
NYSE advance/decline line hit the lowest reading since May 2004. It is on par with the reading of October 2002, so we are very close to a turning point. Bear market rallies can carry some punch, so shorts beware.


We just keep on hitting key markers. Today, probably one of the most important and I suspect we get a bounce out of it. The Nasdaq (COMP)closed right at trendline support from October 2002 (2037.50). That is a must hold tomorrow at the close or we are in real trouble. I think a bounce here would be temporary as a bearish wedge is clearly building on the weekly chart. Furthermore the 10 weekly ema has crossed the 20 weekly ma, and that not healthy to say the least. In any case, keep an eye on COMP 2038 at the close tomorrow.

Tuesday, October 11, 2005

Monthly chart of SPX (S&P 500)with the basics. The close below the August 2004 trendline support sets us up for a test of 20 monthly sma around 1165, just above 50% 2000/2002 at 1160.75. This is a very real possibility if we lose 1178 (61.8% April 2005 rally, not shown). Resistance is now the 10 monthly at 1197. The 20 monthly has not been lost since 2003 (green line), so bulls need to hold on to that one at all costs, or face a 2001 and 2002 scenario.

Monday, October 10, 2005
The damage continues as pundits keep calling a bottom and it is nowhere in sight. We need a true capitulation day or we will stay range-bound through the end of the year. If SPX loses 1180, it is a ride straight down to 1140. A possible crash scenario (always a low-odds play) would have that DOW gap at 9487 (October 2003) a likely target. I have mentioned that target since July and there is no better environment than now. That said, I notice lots of put activity for next week and that is usually supportive. The big test will be the July gap close for NDX at 1533 (QQQQ 37.77). Not very far.

Sunday, October 09, 2005
That buy program that hit near the close on Thursday was at the August 2004 supporting trendline for SPX (S&P 500). It should provide support for a mini rally to about 1206, 38.2% and old trendline support from March 2003, now resistance. The longer term support line is the most relevant, and until the March 2003 support line is acting as resistance, there is still downside risk. If long, trail your stops and play it safe.

click on chart for full size

Thursday, October 06, 2005
Late day V bottom bounce. The DOW broke down below 10285 trendline support but managed to pick up the pieces when NDX bounced at 1540, 61.8% retrace and 5 points above 200 dma. There is a July gap that is not closed yet. Frankly, I'm surprised we didn't finish the job and it leaves us wondering -- as usual. If bulls can hold on, we might have put in place a bottom for now, although SPX 1212 should be tough resistance. NQ traders, watch 1587 resistance (use for QQQQ). The stop on YM short from 10708 is lowered to 10525.

Wednesday, October 05, 2005

S&P 500 (SPX) closed below the supporting trendline from the March 2003 rally for the first time. This might just be a blip, an anomaly, but technicians will look at this as an important turn of events. The bull market is 30 months old and by all measures, getting a little long in the tooth. This is the first real crack. We will see how it handles it in the coming days. In any case, weekly oscillators are not even oversold, so there is more room to go. I don't need to add that we also closed below the 200 day moving average and the 10 month moving average. It was a 15 to 3 down volume day on the NYSE and that could prove to be supportive, if it wasn't for the fact that TRIN and PC ratios hardly showed any sign of real fear given the deteriorating picture. If you want to chase this long, use tight stops. The DOW has trendline support from October 2004 at 10285. The YM short from 10708 stays open.

Tuesday, October 04, 2005

YM (DOW futures) dropped 152 points from high to low and closed near the lows at 10453. As you can see on this chart, there has been nothing bullish going on since the top was hit on July 21st. Bulls need YM to hold on to trendline support around 10437. The DOW cash has pretty much given up on its 200 dma and SPX has now closed below the 50 dma. Look for that index to test 1200 soon.

They suckered in a few more longs and just slammed the door shut. Window dressing is over and now it is reality and they are selling the markets.

Monday, October 03, 2005
VXN is showing once again excess complacency, relative to the VIX . Check out Bernie Schaeffer's great piece today. This guy is on top of it. LINK
Retailers are in for a tough Christmas and smart money knows this. Just look at the RLX chart, trading below the 200 dma for the past eight days.
Tomorrow could see some tech excitement with the Sun/Google news, but it will probably be at the expense of MSFT. Everyone is waiting for the jobs report later this week anyway.

Today was all about interest rates and they are going up, no doubt about that.
YM (DOW futures) rebuffed rather forcibly at 61.8% August decline (10633) and looks weak below 10561. Look for a retrace to 10492, weekly S1. DOW cash closed below 200 dma.
ES (SPX futures) is having trouble with the 50 dma (1234), but SPX cash managed a tentative close above. ES still looks strong above 1229, 10 day ema. Weekly pivot is 1228.75, so must hold for ES there. Downside risk is to 1225 (1219 SPX).
Techs and small caps performed better, no surprise as higher rates do not affect them as much, since they usually have more room in their margins.
Oil dropped, but a natural gas bid spoiled that party for equity bulls.
YM short from 10708 stays open.


Daily chart of December Gold. We closed at 10 day ema support and as long as we trade above it, the current momentum is alive (469). It's also the 23.6% retrace of the recent rally. Below that, we have support at 20 dma and 38.2% (462). The overall uptrend remains intact above 450, so I would use any pullback to the 450 area as a buying opportunity.

Saturday, October 01, 2005
ES (SPX e-mini futures) chart. You can see we stalled at 23.6% July rally and are sitting right at 50 dma. Bulls will need to hold 1234 at the close on Monday to prove that the end of week rally was for real.

click on chart for full size

Bloomberg.com: Economic Calendar
ISM on Monday, oil inventories on Wednesday and initial claims on Thursday will give us more clues next week. We're done with end of quarter noise, the DOW closed bullishly above 200 dma and SPX above 50 dma. Bulls need to hold on to these levels. A drop in oil could be a near-term catalyst, but already there are signs that folks will be struggling with their heating oil bills. A quick scan of online financial media shows lots of "Santa rally" talk and fourth quarter optimism. Equity pc ratios show the same trend. Is everyone gambling that the worst is over? Bad bet, I think. I know I keep sounding the alarm since late July, but I have been right so far and I don't see weekly oscillators anywhere near a bottom yet. Here is the pc ratio chart:
http://www.vtoreport.com/sentiment/putcall.htm
Link