AheadoftheNews Blog

A blog on market moving news and futures trades.

Tuesday, January 31, 2006
Google losing some shine?
Watch video

YM weekly pivot is 10857 and seems to be an area of support after-hours. A correction tomorrow sets up 10750. Bonds are not selling off on the feds, interestingly enough.

GOOG has some put support at 400, a must hold for that stock or it is headed to 310. Selling started 20 mns before the close with futures. It was steady, but picked up steam, as if some folks were hip to what was going to happen. I know, I know. There is no inside info floating. Right. Cough. I will run the GOOG chart later, but right now, it could give us a volatile day tomorrow.

Support outlined earlier posts has held and you should cinch up your stops ahead of the Feds. The SOX bearish divergence I pointed out this weekend has done its damage, pulling us right down to support. Now it's time to keep tight stops and see what happens. Stay disciplined as any break below NQ 1708 could send us lower very quickly. If NQ bounces, move up to even, preserving capital is the name of the game.

We reached my target area of support ahead of the Feds with NQ (1710 zone). YM support is 10885, but because of Altria, it might go lower to 10857, so watch that one.

Monday, January 30, 2006
A reader at optioninvestor sent me an e-mail, wondering what my policy was on holding stocks or options ahead of earnings. In light of the action ahead of us, I'm blogging it for all to read.

I want your thoughts about holding stocks and options over earnings. What do you do? Thanks

Basically, it depends on sentiment and what your stock has done ahead of earnings AND where you entered. Add to that your time horizon and you have lots of choices to make. I like to look at option chains and if I see very little put support below, I tend to exit before. If your question is about GOOG, lots of shorts lining up and if they suprise, you can bet the stock will climb further. However, there is some very good analysis out there on their ad business and revenue shenanigans and there is a growing buzz they might miss, hence all the shorts. That is not a stock I would be directional with either way. I think the play with GOOG is a straddle, but those strikes are pretty darn expensive and we will need a big move. I'm staying clear of GOOG, except maybe on a drop to gap close just above 300, where I would be a buyer. Here, not interested.
Basically, if you are going to hold a stock over earnings, I recommend hedging with OTM puts if long , or if you trade futures and the stock is a market mover, be ready to take measures after hours with futures. INTC was a good example on how OTM puts saved the day from a catastrophy. But the real answer to your question is: if you already have a nice profit, why hold over? Take the money and run.

NQ still right under 1725 resistance but holding above support. YM seeing a little more weakness. Oil has gotten comfortable above 68, making a short in the monitor close out for break-even. The SOX has lost some steam and is flashing a few red flags. Something has to give and either way, it will be explosive. Same parameters as yesterday apply. It's all about the Feds, nothing else really matters.

Oil lost some of the bid on an OPEC annoucement they might not cut production. This is supporting stocks at the open. On these kind of days (looks choppy), it is best to wait for reversal signals or clear direction. Trading the middle will just feed your broker and your frustration. The best trade might be a QM (oil) short.
Link

Sunday, January 29, 2006
This Google/China controversy is not going away. Good piece on CNET, see link below. Hmm. Maybe I'll use Yahoo for a while.
Link

Oil (QM) bidding above 68 overnight. Resistance is 68.375 (daily R1), so keep an eye on that. Support is 67.70 and 67.375. If QM keeps the bid above 68, stocks could be under pressure at open.

Saturday, January 28, 2006
NQ (Nasdaq futures) 1710/1713 convergence of multiple support (10 day ema, 20 day ema, 50 day sma, and weekly pivot). I pointed out the bearish divergence on the SOX and we could get a pullback to that zone. Use caution ahead of the Feds on Tuesday. Resistance is 1725, 1733 and 1739.50.
Watch video

Friday, January 27, 2006
SOX (semi-conductor index) to hit a snag soon?
Watch video

Thursday, January 26, 2006
Today's YM session (DOW futures).
Watch video


Good morning everyone. Futures solidly up especially YM. Trade at 10700 long stays open. As you can see on the daily chart, resistance is 10 day ema. Further up, ex-trendline suppport now resistance at 10884, which is the target for the trade. NQ lagging on a relative basis, watch out for that especially key support at 1688. I will be doing this in multi-media presentation very shortly, bear with me while I work on a few logistics.

Wednesday, January 25, 2006

This was a good day for daytrading, no doubt. Plenty of volatility. Direction from here is unclear but all the nearby gaps have been closed. SOX held support and so did NQ. Plenty of ways to make money in this environment, just dont get married to a trade. YM chart shows the importance of 10762 and if it can move past that, next stop is 10813 and further up 10884. It will all depend on how techs hold up, in particular the SOX.

Tuesday, January 24, 2006

The SOX is a standout and bulls are not giving up until it does. QCOM could make or break this index. Closed above 10 day ema and still bullish. The entire tech sector will be dumped if the SOX closes below 511. For now, there seems to be no fear, even as INTC and TXN retreat.


Right on cue, NQ made a pre-open bid to 50 dma, then sold off. After an afternoon rally, we settled right at 61.8% January (1695). We are consolidating at a very precarious spot, right above an unfilled gap. I doubt we proceed much farther without filling it (1688). Oil fell apart but as I commented last night, it might not be enough. QCOM earnings tomorrow will be market moving. As for the DOW, watch YM 10720, January 3rd low and now important support. Long above, short below.

Monday, January 23, 2006
Only two readings above .60 for equity p/c ratio in January with today's reading a cozy .58. Just a little too much optimism in the face of deteriorating technicals. This is why it's good to periodically check equity options, as index options are often used for hedging and don't give the whole picture. If bears are really starting to be in control, any rally should fail at 20 ema hourly chart. We will see how the trading day progresses. The increase in volatility is a welcome development for traders.
Link

Drop in oil is giving stocks support, but it might not be enough. Watch YM 10720, January 3rd low. COMP 2250 has become resistance, so watch that as well tomorrow. NQ 1695 is 61.8% and another one on the radar with 50 dma a little higher at 1705. The one positive is the SOX above 511 and I am not counting the bulls out as long as it holds. But as everyday passes by and tech earnings come in, it is getting harder to justify the rally. Too many disappointments in tech land. I am short QM (oil) on the monitor from 68.275, as frankly I think that one is due for a severe drop once the lunatic in Iran calms down. There is supply and the weather is warmer.
Link

Sunday, January 22, 2006
Coming to the rescue? Jan. 23 (Bloomberg) -- William Poole, who developed a reputation as one of the Federal Reserve's most forceful inflation fighters, said he's less concerned about prices than six months earlier and suggested the central bank may soon stop raising interest rates.


Oil is on a tear, yes, but we are now in overbought lala land and oil bulls pushing their luck. Any hint of good news and we will drop 2 to 5 points in a snap. Next resistance is 69.45. A break above is clear skies to new highs, failure could end the run. Needless to say, a drop in oil prices will be supportive for equities. My bias at this point is for oil to drop and equities to rally, but play it safe and use tight stops. NQ is at trendline support and monthly pivot.

Saturday, January 21, 2006


COMP lost 2300 again and it was downhill from there until it stopped at 50 dma, now critical support (2247). It was just too much bad news and the bulls dropped the ball. Oil hit 69 (March contract), earnings projections disappointed and there were no buyers to be seen. Option expiration players tried to hold us up as all those puts went in the money, but their efforts failed and they were forced to cover the puts they sold by shorting the market adding to the pressure. It was ugly.
Where do we go from here? Short term, YM could find support at 10662, 50% (see chart 1). QQQQ will most likely also find support at 41, trendline off October low (see chart 2). Longer term, be aware of that gap at 39.35 which will be filled at some point. That would be a 10% correction off highs, nasty but a good long term buy. I am noting an inordinate amount of puts lining up for February expiration as pessimism mounts. In fact, the QQQQ FEB 41 strike has 359K puts to 29K calls, given us a staggering ratio of 12.38. The 40 strike has a PC ratio of 6. This is extremely supportive and although we might go down and close that gap at 39.35, I would definitely be long going into February IF we are at those levels.
How could bulls pull out of this? Simple. The Iranian crisis gets resolved. Add balmy weather (see link), and oil could be under pressure soon. That's one. Secondly, we have more earnings to come, especially TXN and GOOG, not to mention MSFT. Any good news there and shorts will cover. Lets not forget the Feds who might come to the rescue. So bears should enjoy the show for now, and there is more to come, but in February, depending on where we are of course, bulls could take over again. Right now, we need more optimism to wind down in order to put in a bottom. Those excess bullish advisors were a red flag, no doubt.
Link

Thursday, January 19, 2006
Bullish advisors creeping back up again and this is becoming worrisome as sentiment no longer is justified by earnings outlook. With a few more big name earnings to come, bulls could have one more spike in them, but I am going to start thinking short soon. However, I am noticing a large build up of puts for next month QQQQ and it could mean some short covering moves. Tricky times ahead, but I am still leaning towards the long side, but very cautiously.
Link


COMP chart: another close above 10 day ema. Battle lines are drawn. Line in the sand is 2270.


YM failed at 10 day ema, very clear resistance. It was a nice day trade, but should we lose 10880/10885, bears get the reins again. Basically, opex is keeping the markets up. Still a few big guns left. MSFT, GOOG, TXN, DELL, CSCO. My suggestion that they want to close the week at QQQQ 42.50 seems to be playing out.

QM trade stopped out -.035 and oil bulls reaching for new 2006 highs. Along with several earnings dim forecasts, it is becoming hard for bulls to justify the equity rally at this point.

Exited the QM short on the monitor for +1.35 ($675 per contract), re-entered March contract short at 66.50, stop 66.80. This entry comes out to 60 cents higher than the exit and with the stop preserves + 1 for the day. NQ long was exited as well for +11.50 (+$230 per). It seems opex is pinning the Q's at or near 42.50.

Wednesday, January 18, 2006

There does seem to be some unfinished business, but we will ride along for now with caution. Those two gaps below are not to be ignored.

This would be welcome news. We might get some overnight stops that actually get executed.
Jan. 19 (Bloomberg) -- The New York Mercantile Exchange, the world's largest energy market, may shift electronic trading of its oil, natural-gas and gasoline contracts to the more widely used Globex system of the Chicago Mercantile Exchange.

The Nymex board has formed a subcommittee that is considering using the CME's Globex, the biggest electronic- trading system for interest-rate futures contracts, to replace its Access system for after-hours trading of energy futures, according to two people briefed on the matter who declined to be identified because the deliberations are private.

QQQQ found support at 42 and opex players held us up (see Monday's post for setups). Reading open interest is absolutely key to trading option expiration week. I profiled an NQ long at 1725, stop 1720, in the monitor after the close today. We should see a bounce tomorrow (Thursday). Oil is falling, COMP held 20 dma support and NQ 38.2% January. Should we get there, the oil trade will be closed on a drop to 65.10. I will start trading March contract tomorrow, this will be the last trade for February oil.

Lowering the QM stop to 66.70, even. The short is +.70 ($350 per) and multiple contract traders should take partials. My guess is that we start trending down soon with oil, but it is best to play this one safe and keep tight stops.

COMP 2265 is the line in the sand (20 dma). Entered a QM (oil FEB contract) short at 66.70, stop 66.85 on the monitor.

HONG KONG (MarketWatch) - Tokyo Stock Exchange officials ended trading 20 minutes before the regularly scheduled close Wednesday, as a cascade of orders threatened to exceed the systems' 4 million-order capacity, and as stocks tumbled for a second day.

Tuesday, January 17, 2006

YM trendline support off October low is 10817 and where bulls will have to make a stand.

It's all bad. QQQQ should close that gap at 41.92, I would not touch a long until that happens. I profiled all the put support areas and we will visit them. How can the CFO of INTC on December 8 guide to 10.4B in revenue and come in so far off? And then tell us we will only be sub 10B next quarter? You do not do that to the Street and INTC will pay the price. I any case, I hope you picked up some Jan 25 puts to hedge, they should be worth $2 and make the APR 25 calls free. INTC wlll pull out of this, but for now, let the negativity play out.
NQ (NDX futures) at weekly S2 support overnight (1726) so we will see how it plays out tomorrow. YM has collapsed below its weekly S2. It could be ugly tomorrow.

INTC misses and January 25 puts hedge are in the money, protecting the Apr 25 calls.

Comservative traders would now hedge the INTC APR 25 calls with January 25 puts or if you trade futures, be ready to short YM since it will be open during earnings annoucement. NQ might be closed (4:15 to 4:30 is globex close, ECBOT stays open until 5 PM).

Big sell-off in Japan. We could see a gap down open. YM support below 10957 is 10937, then 10924/10911. So far, looks like the descent has stalled at 10950 and NQ 1748. Watch QM (oil) 65.

Monday, January 16, 2006

Since this is option expiration week, we need to look at some relevant information. I say this because no matter how bullish or bearish things can be, the underlying forces of opex exert undue influence and cause traders to miscaculate support and resistance.
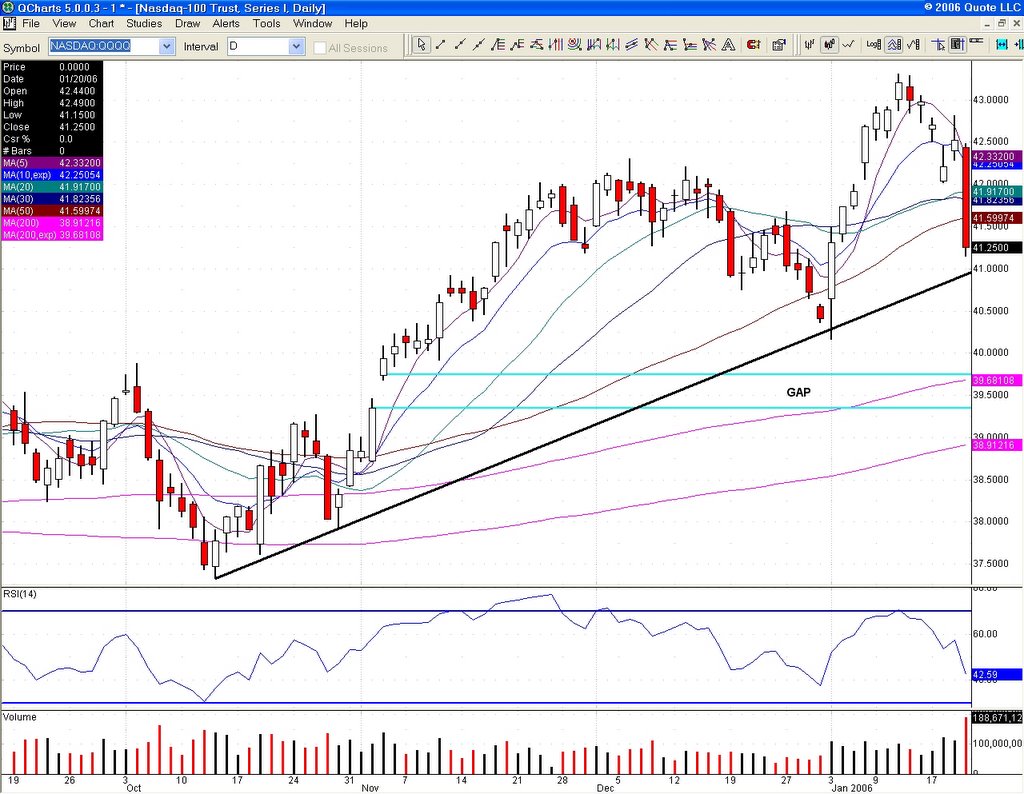
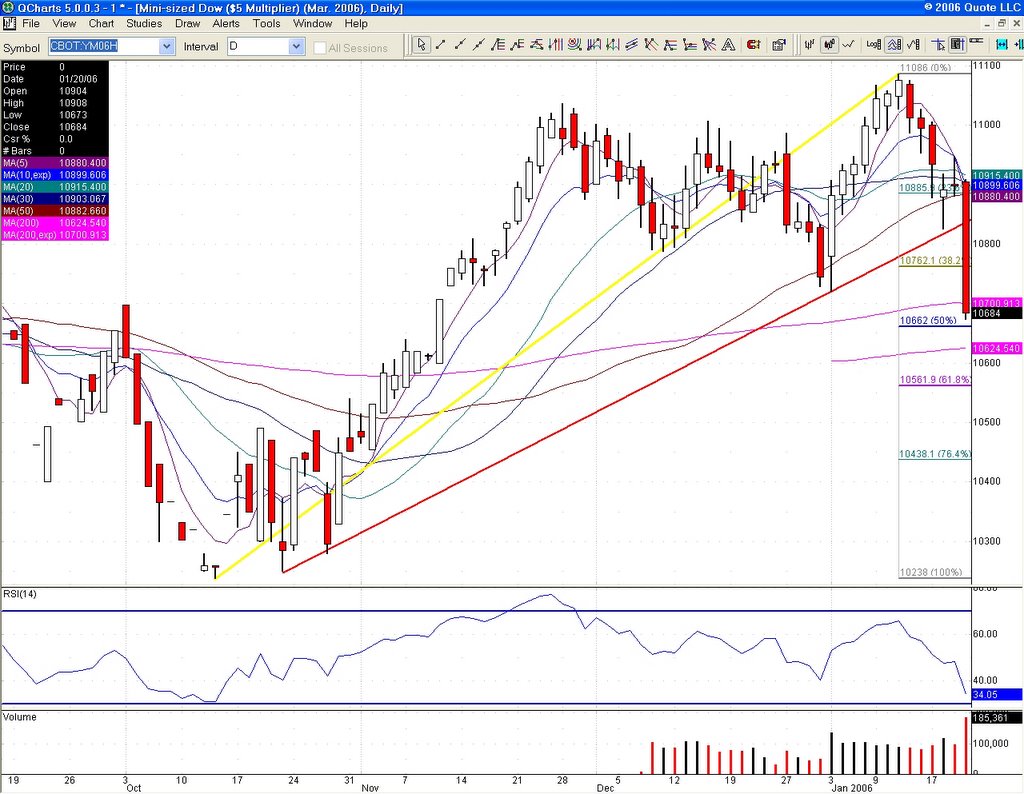
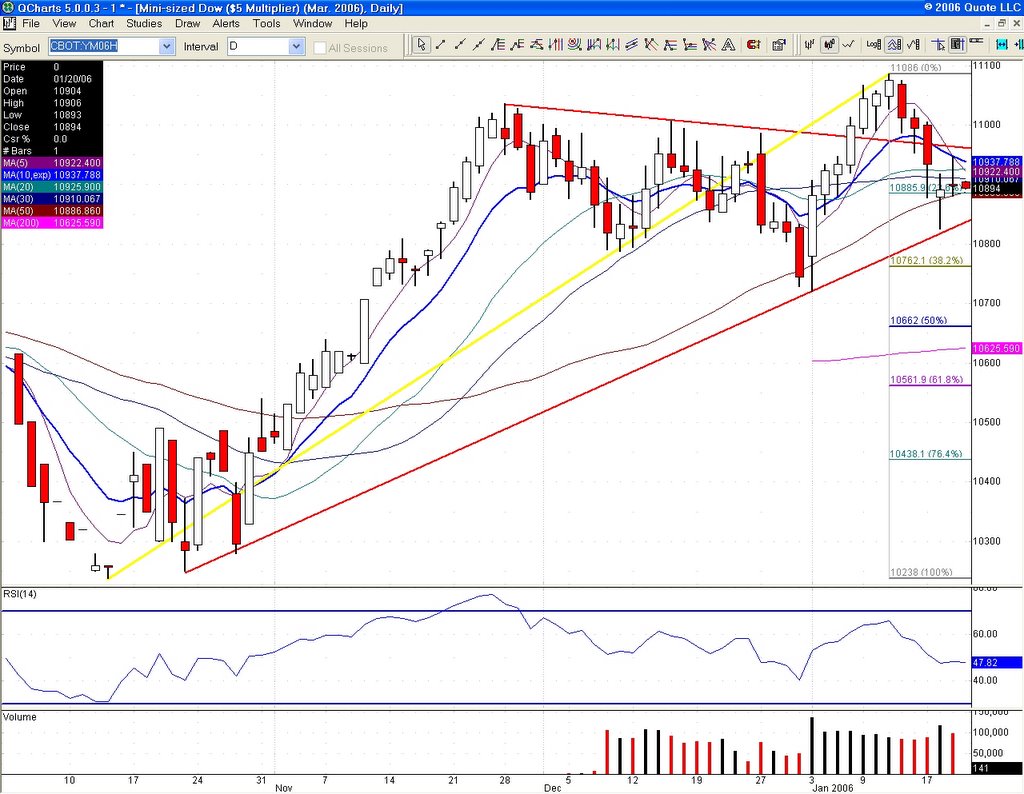
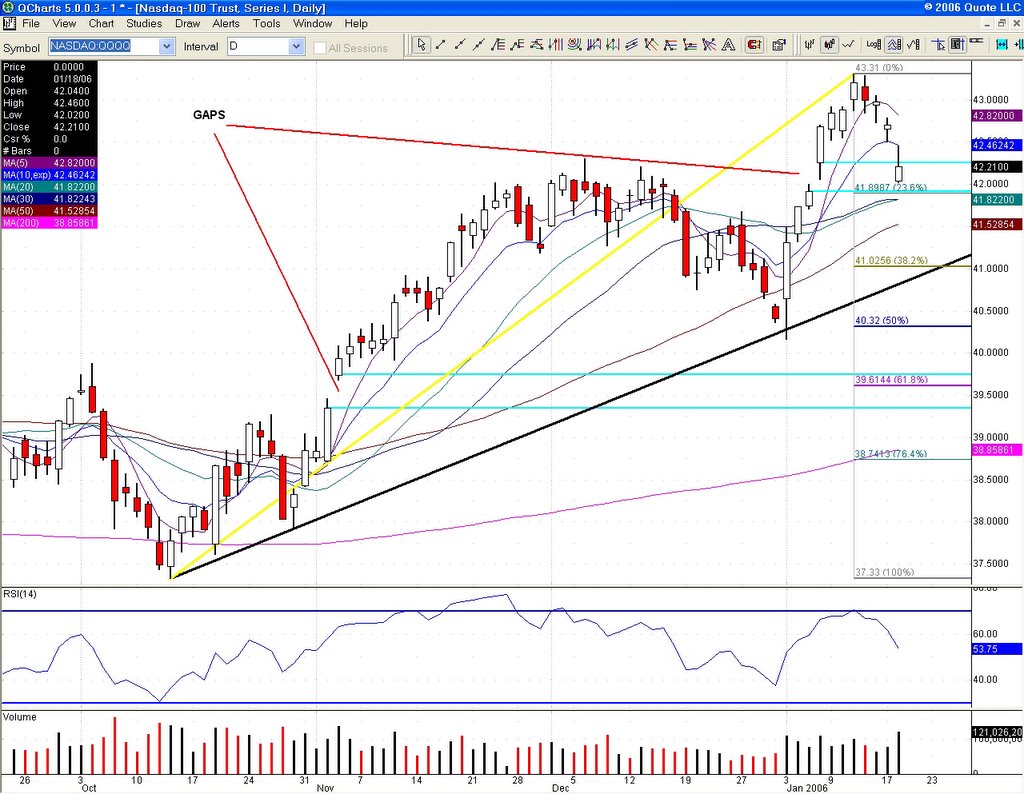
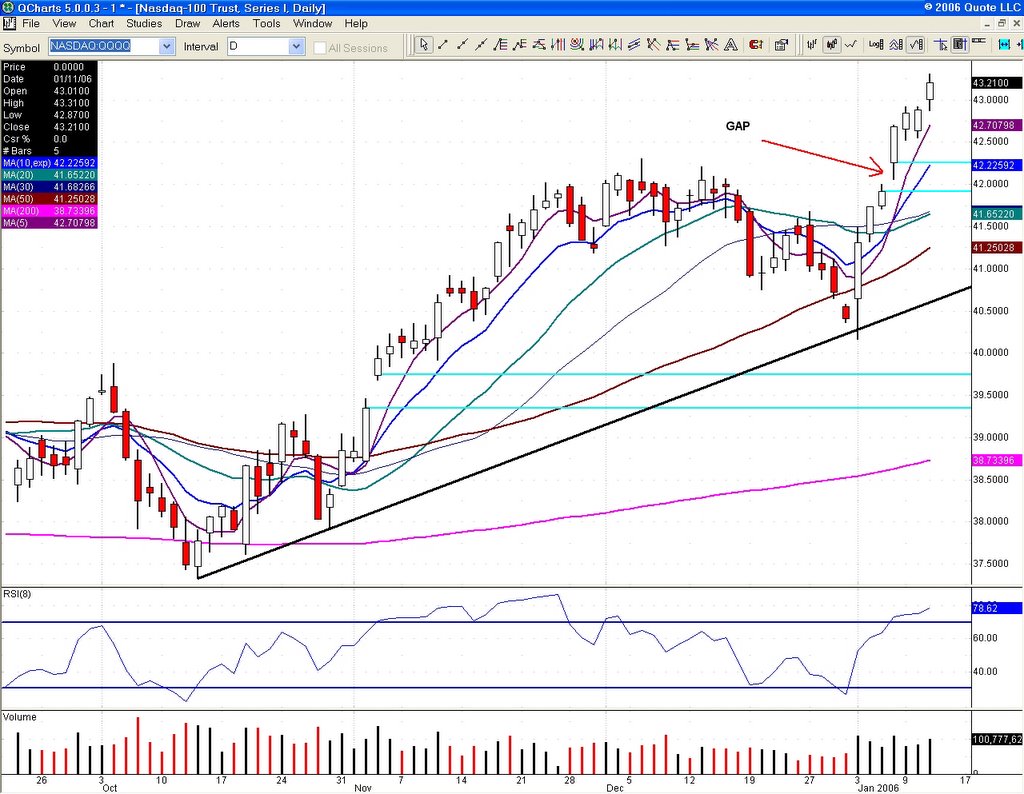
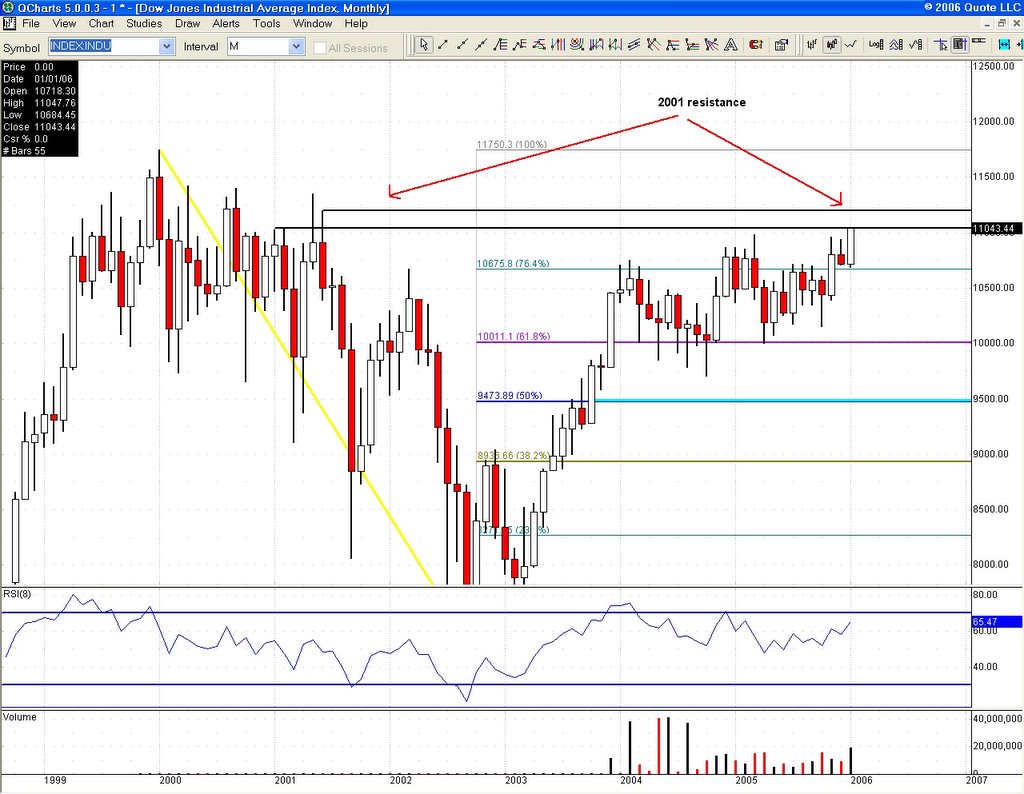
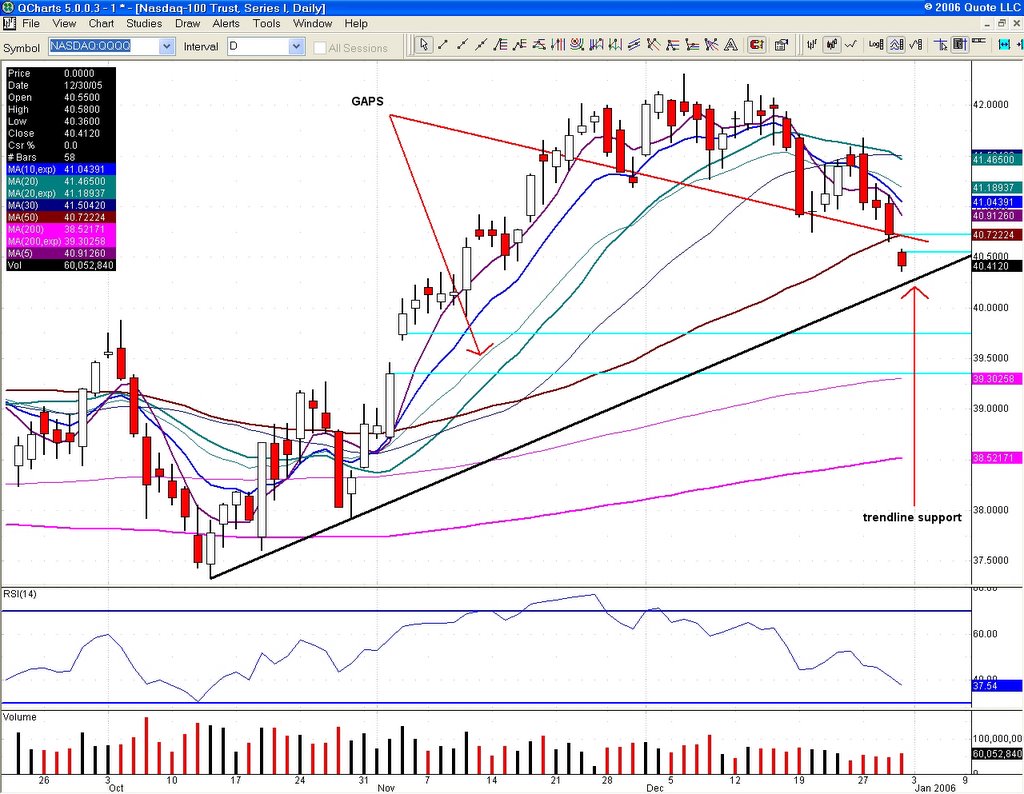
QQQQ has max pain at 43, but stronger put support at 42, which has a pc ratio of .92 compared to .75 for 43. In other words, resistance at 43 and support just under 42 (there is also a gap to close there). SPY has little put support until 127, max pain and .94 ratio and that one is the most vulnerable to a quick drop. 128 strike has .40 and 129 .28, a pretty tough climb if you ask me. As for DIA, max pain is 108 with strong put support there and a 1.27 pc ratio. .76 at 109 and .70 at 110. Conclusion? Techs look like they have closer support than the broader market, but could see some selling pressure. SPX is particularly vulnerable.
I had profiled an INTC long with APR 25 calls. Realize that this trade is for a longer term horizon as I see lots of puts building at 25 strike after this opex. Unfortunately, for the coming week, one might want to hedge with some cheap Feb 25 puts, although there is growing put support building and it could surpise us all. Clear resistance there at 27.5, but after opex, we could close that gap above 28 and that is why I am throwing that trade out there. I like buying a strong 1st tier company that has been unduly punished the past quarters while others in the same sector explode higher. But be ready to protect the trade after hours with some YM or NQ puts if need be, or as I suggested, pick up some 25 puts at near-term. If we rally strongly prior to release (Tuesday), then exit the trade and book profits. This is not the week to be a cowboy.
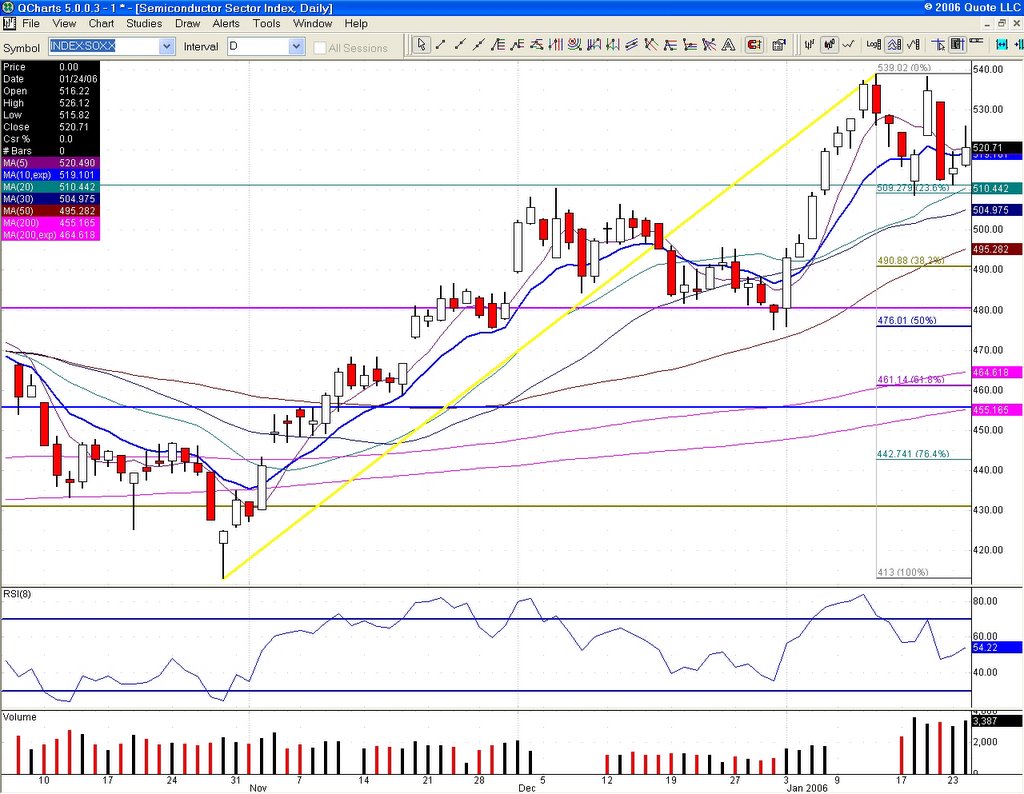
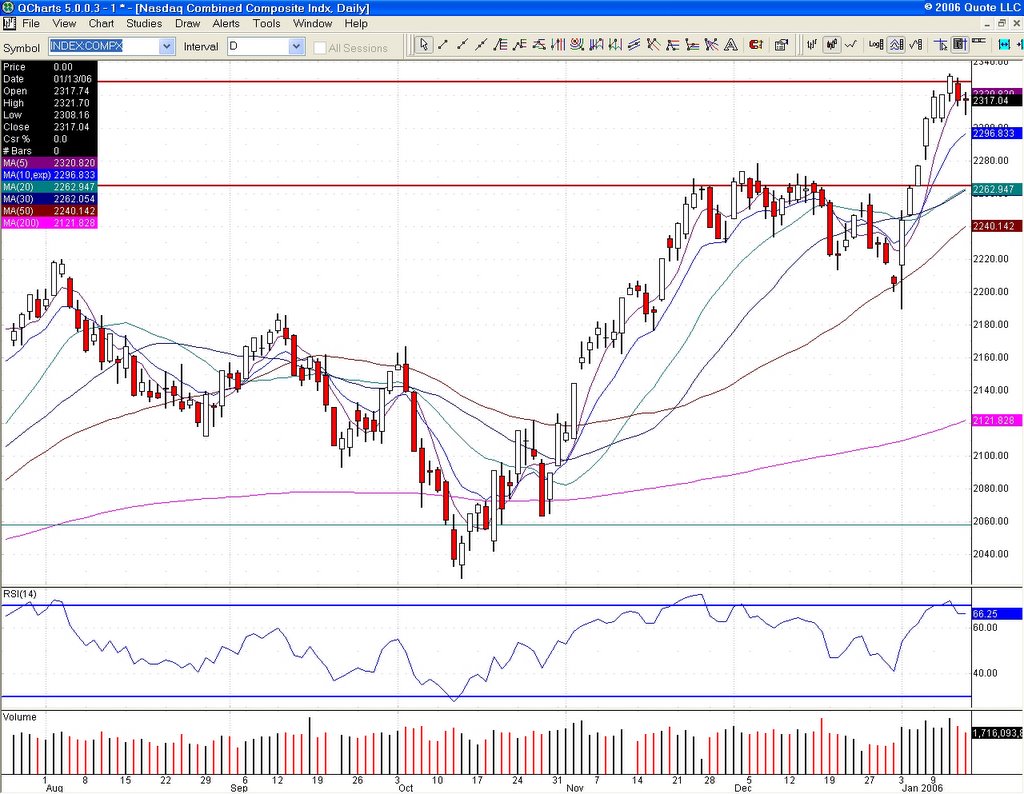
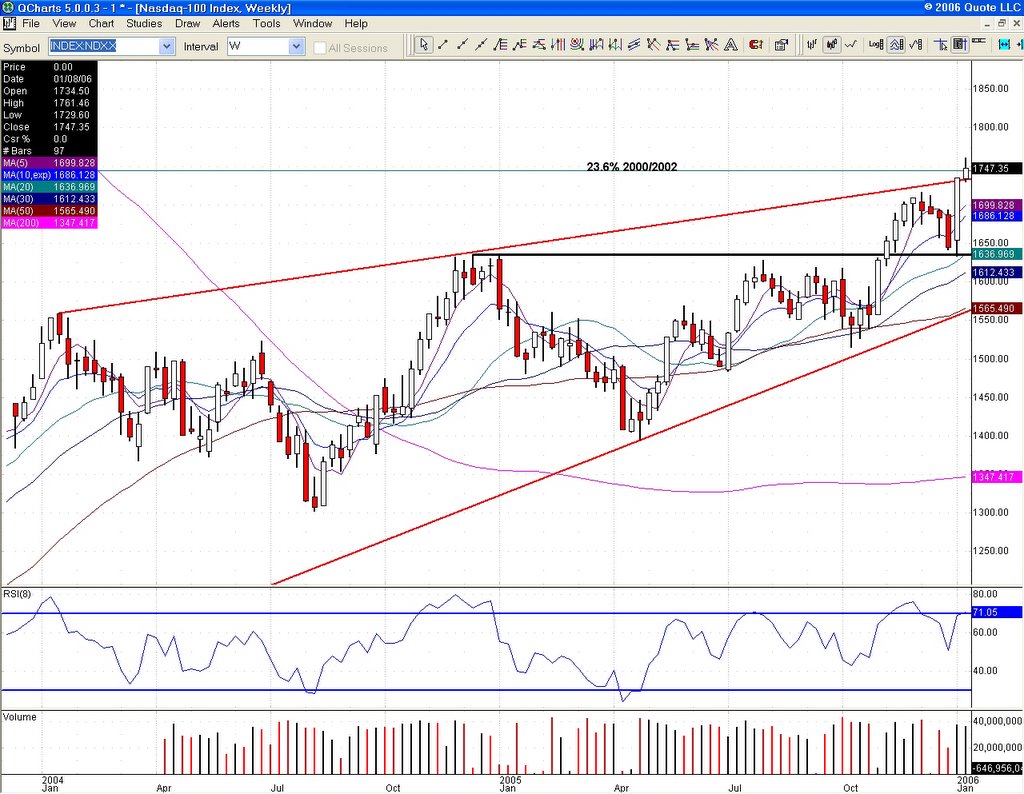
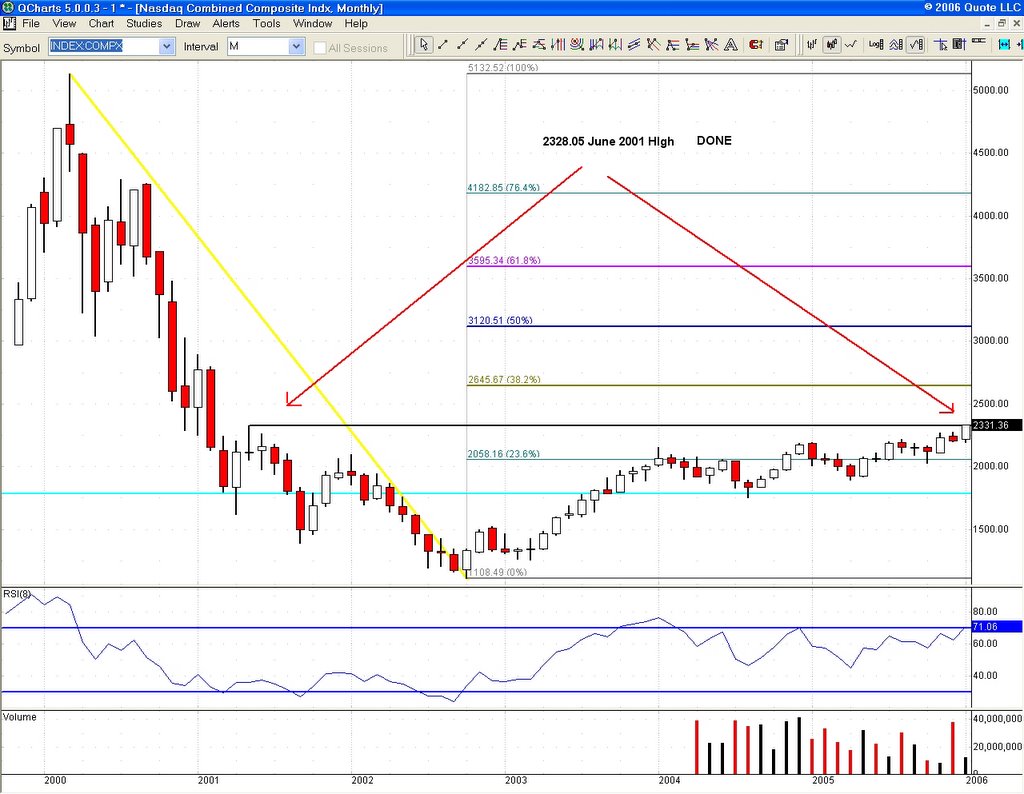
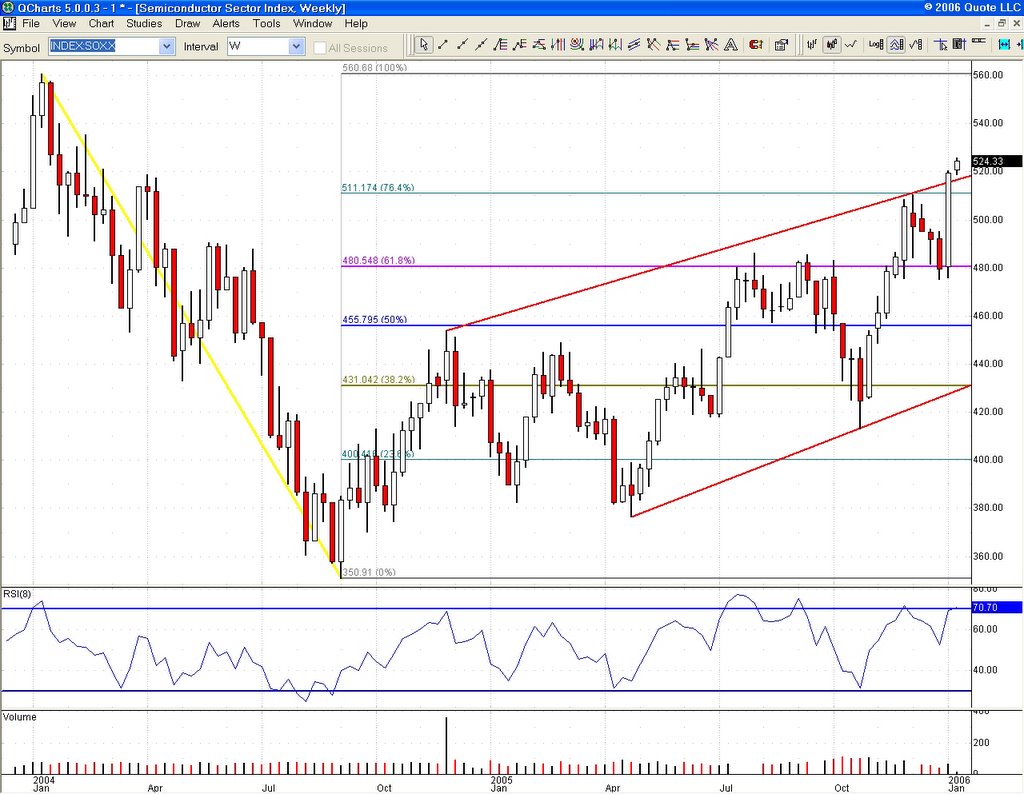
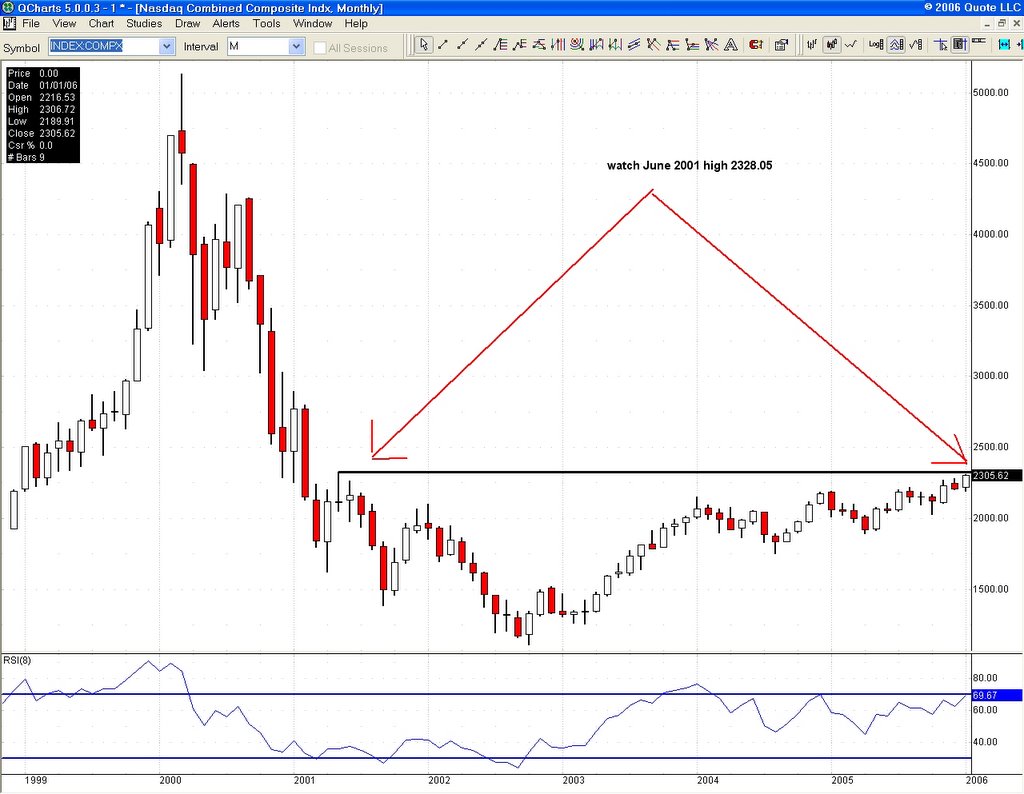
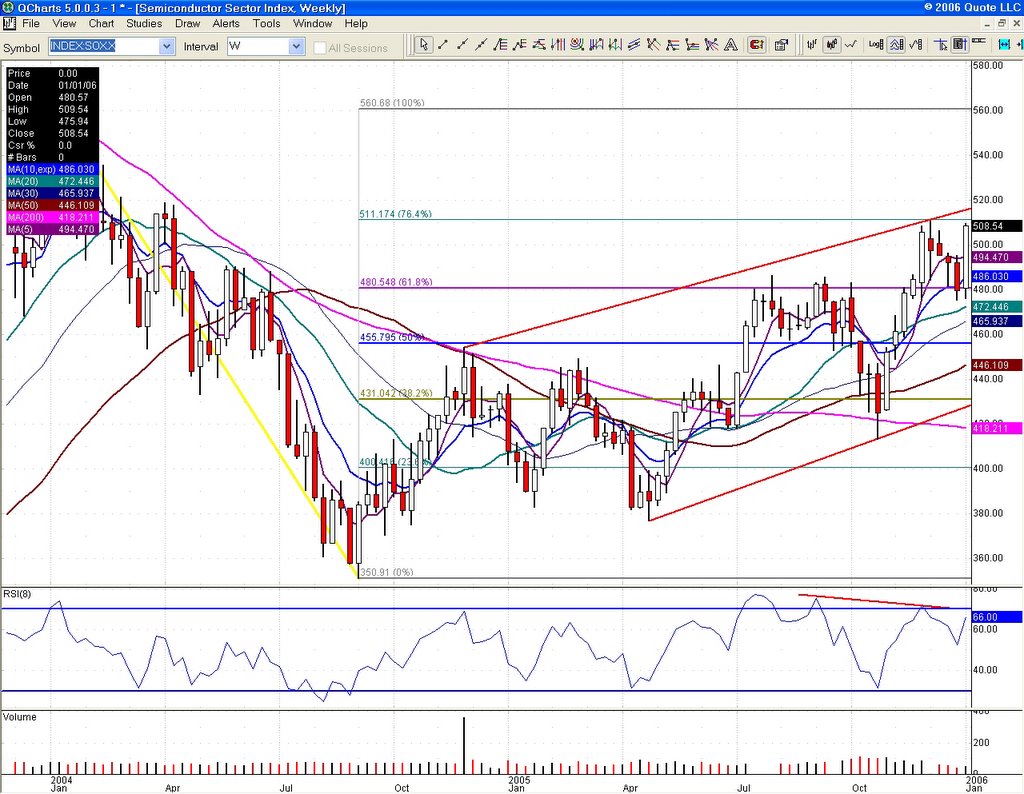
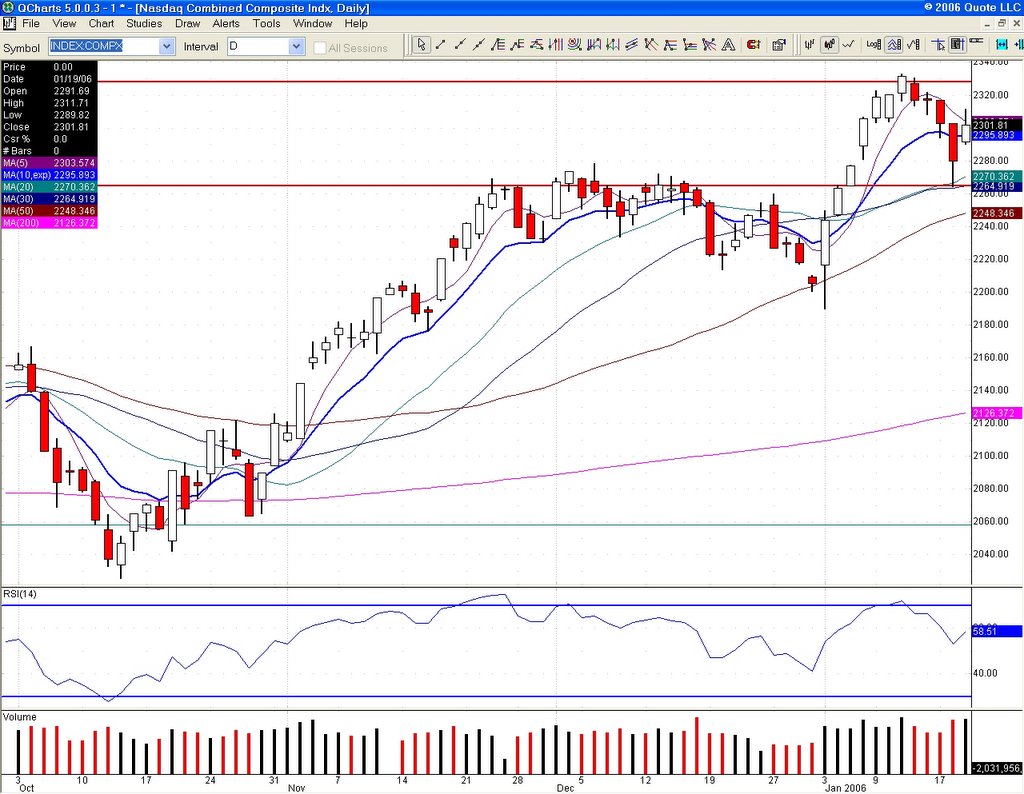
As for charts, the one to watch next week is the COMP and how it can manage to stay above 10 day ema at 2296. There is risk to 2262 should it fail to hold 2300, but I doubt we correct much lower than that, unless INTC and MSFT completely miss. SOX 511 is also a key number. I am bullish on techs, more so than any other sector as electronics was the ticket this holiday shopping season, although I would stay clear of some of those high flyers. But as I mentioned earlier, watch those options!
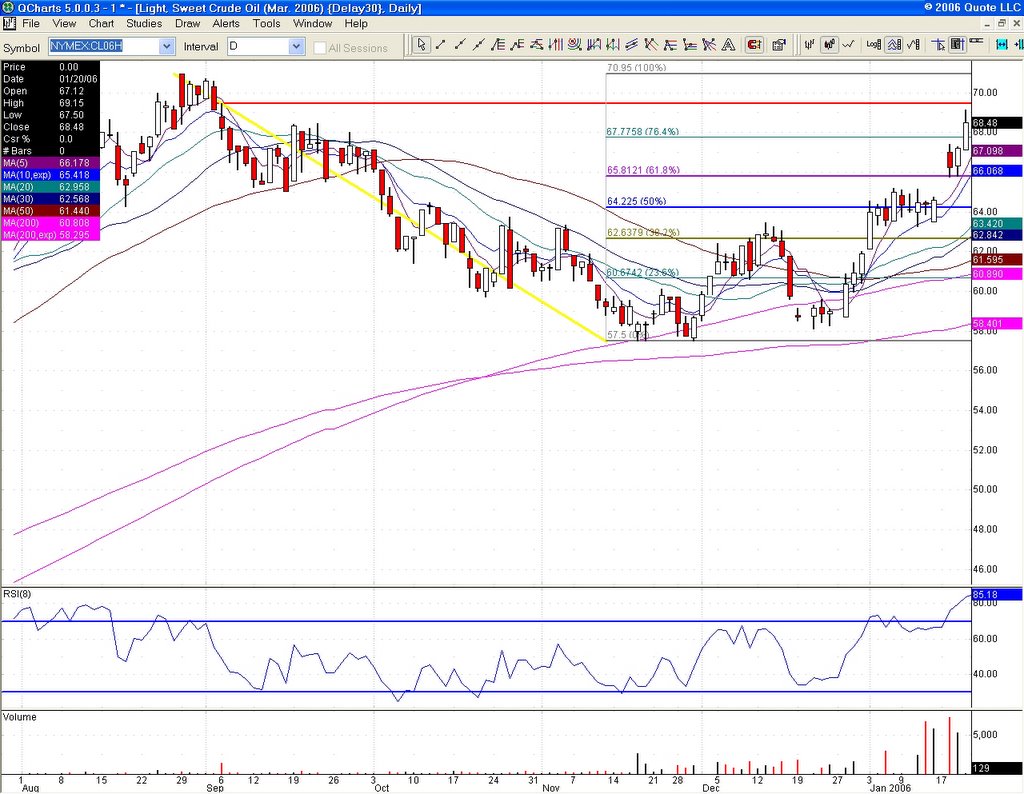
Oil of course is also on the radar, but if the talks with Iran calm down, we could see a drop to 61/62 in less than a day. Any problems and we could shoot straight up to 65.675, 61.8% August/November. Obviously, something else to keep an eye on.
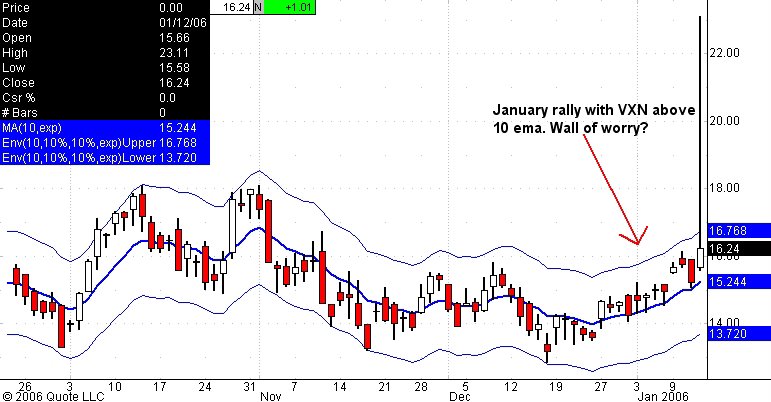
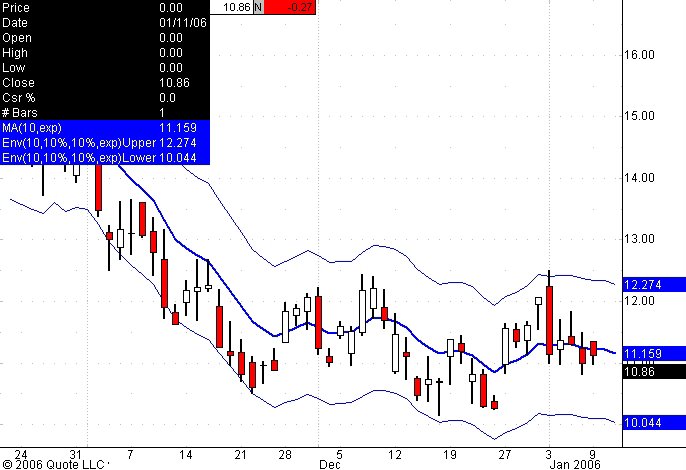
As for volatility, VXN is closer to the upper envelope than the VIX which has much more room to rise.

Friday, January 13, 2006
Picking some INTC APR 25 calls at 1.80. I think INTC is due for a big short covering rally soon. It as been lagging and expectations are very low.

Thursday, January 12, 2006

VXN (NASDAQ volatility index) has been steadily climbing through this rally and that is very unusual. Is fear coming back to the markets?


Bears scored a three pointer but not a touchdown. NDX held on to 1744 support, 23.6% 2000/2002, a very important level. Where we go from here is anyone's guess, but we are have a three day weekend ahead and key earnings next week. A bit of fear is expected and would be healthy. We also have option expirations and you can bet they will try to pin some of those strikes. Trade every day like a new day, no bias.

Wednesday, January 11, 2006

Before we get all excited, a look at QQQQ option open interest (see link below) for January shows heavy call activity at 43 strike. Add that gap below at 41.92 (chart), and you know I am thinking pullback. I would short a move to 43.50. That does not mean I think the rally is over, just that we are due for a push down. In fact, the range in the coming two weeks could be confined to 42/43. After that, I see a possible rise to 44 by February. But let's not get ahead of ourselves and take it one day at a time. I also want to see the bull/bear sentiment numbers tomorrow.
Link


The NASDAQ is less bashful and did the deed today, closing above 2328.05, June 2001 high. This is something I had on my radar since last week and now we have to see if we can hold this level. Short below, long above.


The DOW is fast approaching key areas of 2001 resistance. Right now, if it manages to hold above 11035, upside potential is 11196, June 2001 high. I don't think we will get there this week, but one never knows. Start nibbling at shorts, but keep a tight leash, just in case. I am still looking at weekly R1 for YM at 11101. By the way, weekly R1 for QQQQ is around 43.50.

Tuesday, January 10, 2006

Chart of the VIX with 10% envelopes off 10 day ema. As you can see, this set up gave us a perfect buy signal the first day of trading in January when the VIX shot up to the upper band. Since then, the entire rally was with the VIX trading at or around 10 day ema, which leads me to believe volatility is on the rise as previous rallies of this magnitude have always seen the VIX move to the lower bands.

A cold front moving in this week is keeping crude above 63. Inventories tomorrow should give us direction. The great thing about trading oil is that once the direction is set post inventory, it usually sticks for the week.
Link

The next few days are key. I am about to turn short term bearish if NDX cannot get past 1745 soon. The same goes for COMP 2328. The short trigger will be a YM run to 11100 that fails. If NDX 1744 becomes support, stay long.
YM weekly R1 is 11101 and frankly, with super Tuesady coming next week, I doubt we will get past YM 11100, so I'm inclined to short such a move. One can also play the long side provided any dip stays above YM 11005. The range should tighten.
Note: YM quotes are not DOW cash. There is a premium for March futures, so adjust.

Monday, January 09, 2006

A few days ago, I commented on the SOX and a possible breakout. It has now happened with a two day close above old trendline resistance and 560 is now in sight if 512 holds. COMP did find resistance near that June 2001 high and NDX could not close above 1744, another key number, so we could be due for a consolidative pullback especially considering all these nagging bearish divergences. I will also add that QQQQ faces a wall at 43 with an absurd put to call ratio. It will be a miracle if the Q's manage to get above 43 for very long. Alcoa just hit YM after hours with a profit warning, so expect some selling pressure tomorrow. YM support and must hold is 10911 (weekly pivot).

The play for bonds was to be long ZT (two year)in anticipation of a steepening curve. Keep an eye on it, as it is the barometer now for fed action. A perception that the feds are almost done gives a bid to ZT. If the feds are going to hike more than thought, ZT will sell and the curve could invert again. This is what the pros are watching right now.

Sunday, January 08, 2006

We are at a major crossroads and price action in the next few days will be critical. There are daily RSI and MACD bearish divergences on just about every single index out there and VIX/VXN are at historical lows. Call resistance above is quite clear. This is not the time to jump on the giddy bullish bandwagon, however if you are long from the opening January lows, you can afford some leeway and should just simply move up your stops. For the DOW, that would be 10830 and for the COMP 2245 (watch those 20 day moving averages!). A look at the attached chart shows that the Nasdaq is very close to the June 2001 highs at 2328. A close above will usher in a whole new paradigm, a failure here will set up another round of consolidation. The media will focus on DOW 11K, but I will be watching the COMP and the SOX. Let price dictate your trade, not your bias. Keep an eye on oil as the markets will not tolerate another week of trading above 63 and neither will the consumer. Aggressive traders can consider shorting an opening spike if techs look weak and the VIX hits my lower envelope at 10.12/10.20. Otherwise, let it ride and play with the bulls if they close the COMP above 2328. I am more of a stock picker at this point.

Thursday, January 05, 2006
5% drop in bullish advisors last week. This adds credence to the notion that short covering helped this rally. Still way too many bulls out there to give this rally any solid base of pessimism, so trail your stops.
Link


The SOX, while not knocking on Heaven's door like the DOW, is nevertheless hitting a nice stride in the upward channel started in 2005. Trendline resistance is at 515, with an important fib at 511.18. I am noting some bearish divergences so bulls should lock in some profits.

The jobs data will take center stage tomorrow. Wage inflation could very well be a concern. Markets want in line numbers, no upside or downside surprises at this point. My bias is for the DOW to sneak past 11K, with a YM (DOW futures)target of 11077, but it could find some selling pressure there.

Wednesday, January 04, 2006

Chart of the day: The DOW. As you can see, we are right at the trendline resistance from 2000 high. This time, it looks like we could actually close above it. If that happens, DOW 11K will get hit and shorts will scamper. Another failure of this test will send us back down rather quickly. I have a feeling bulls mean business, but we still have the jobs numbers on Friday. YM (DOW futures) has support at 10911, weekly R1 as discussed earlier and confirmed by the after hours low.
My tech pick of the year is Intel (INTC). At some point this year, they will start loading up on the big chipmaker in anticipation of the MSFT new Windows VISTA release. I am long INTC 25 APR calls as of Friday.

Intraday update: Watch YM 10850 support (DOW 10810) for a possible run past 11K for the DOW if YM breaks above 10925 (there is a 40 point premium currently between DOW cash and YM March futures). COMP 2265 is the next hurdle and a close above sets up an attack on 2005 highs and 2325 this week. All will depend on today's follow through.

Tuesday, January 03, 2006
DOW found support at 10700 and QQQQ just above 40 and the ensuing rally blew away all the December shorts. The VIX had posted a reversal signal this morning and we got it, no doubt. Long INTC calls and shorted QM (oil) in the monitor at 63.625.

Monday, January 02, 2006
Resistance this week will be around YM 10870 and support YM 10650. We are due for a nice technical bounce but last week showed the highest percentage of bullish advisors since Dec 04. Book profits quickly in this kind of environment.
Link

Sunday, January 01, 2006

QQQQ has a gap above at 40.72 and below at 39.35. Trendline support is 40.25 as of now. These are the levels to watch next week. I expect us to bounce to at least 40.72 and close that gap. What we do after that will be key. One thing for sure, we will eventually close that gap below at 39.35.