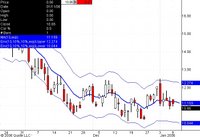
Chart of the VIX with 10% envelopes off 10 day ema. As you can see, this set up gave us a perfect buy signal the first day of trading in January when the VIX shot up to the upper band. Since then, the entire rally was with the VIX trading at or around 10 day ema, which leads me to believe volatility is on the rise as previous rallies of this magnitude have always seen the VIX move to the lower bands.