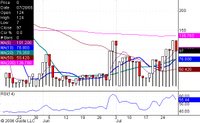

NYSE year lows at 37, year highs at 96. As you can see on these charts, we have had a steady drop in new lows (left chart) since the high in June and a rise in new highs (right chart), supporting the bullish posture at this point.
This entry was posted
on Friday, July 28, 2006 at 8:37 AM.

