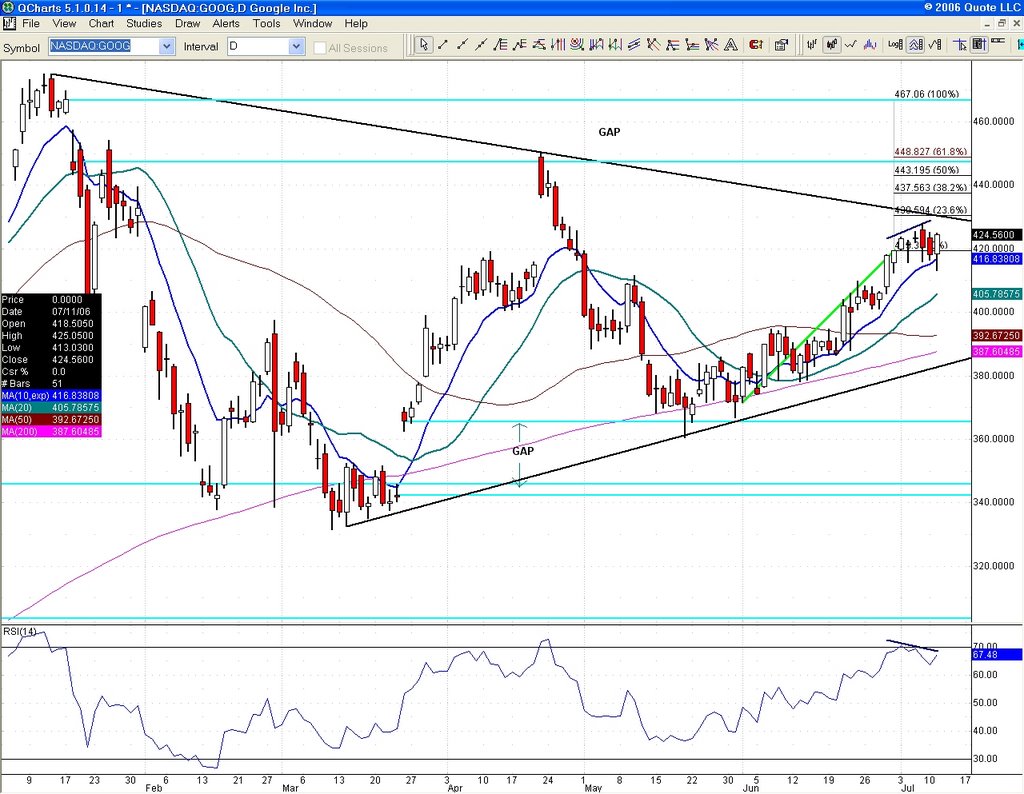
A quick look at the GOOG chart. A bearish divergence on the last rise gave us a two day decline, but the stock snapped out of it today, like many other techs. The question going forward will be trendline resistance not far above at 430, which is also 23.6% projection June. The good news is that it is part of a symmetrical triangle whch is normally a continuation pattern. A break above 430 sets up 100% projection June at 467 and a close of the January gap. Not a bad ride if it happens. Watch the action at 430.
This entry was posted
on Tuesday, July 11, 2006 at 5:35 PM.
![]()
![]()