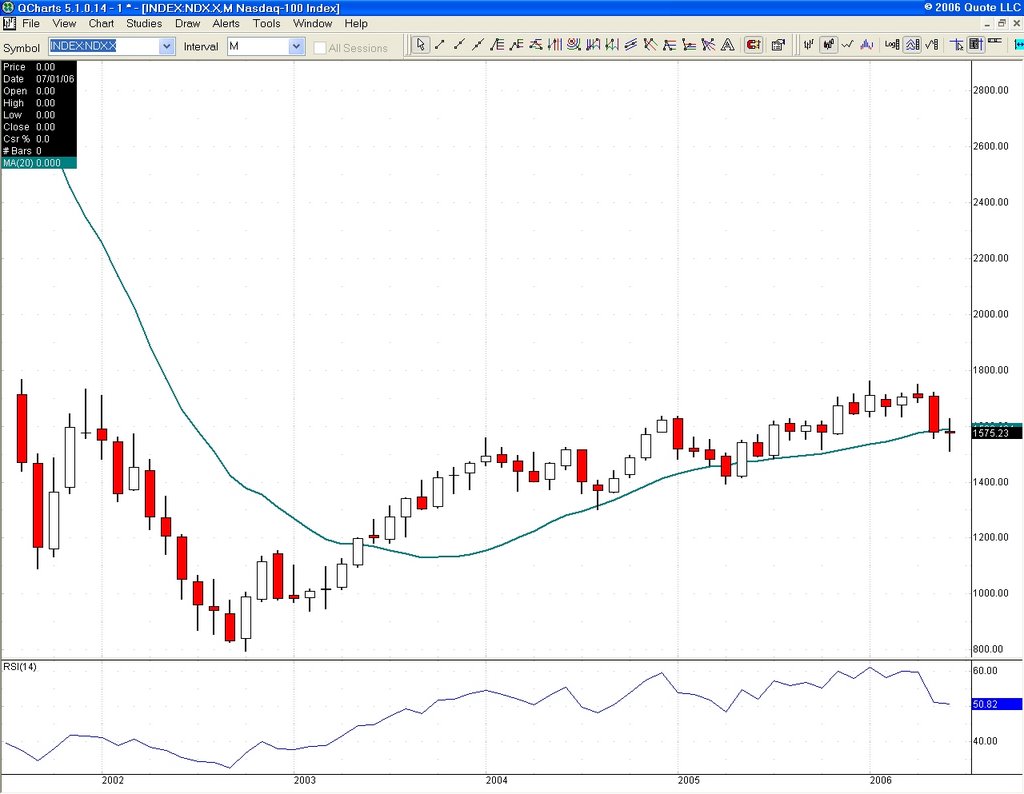
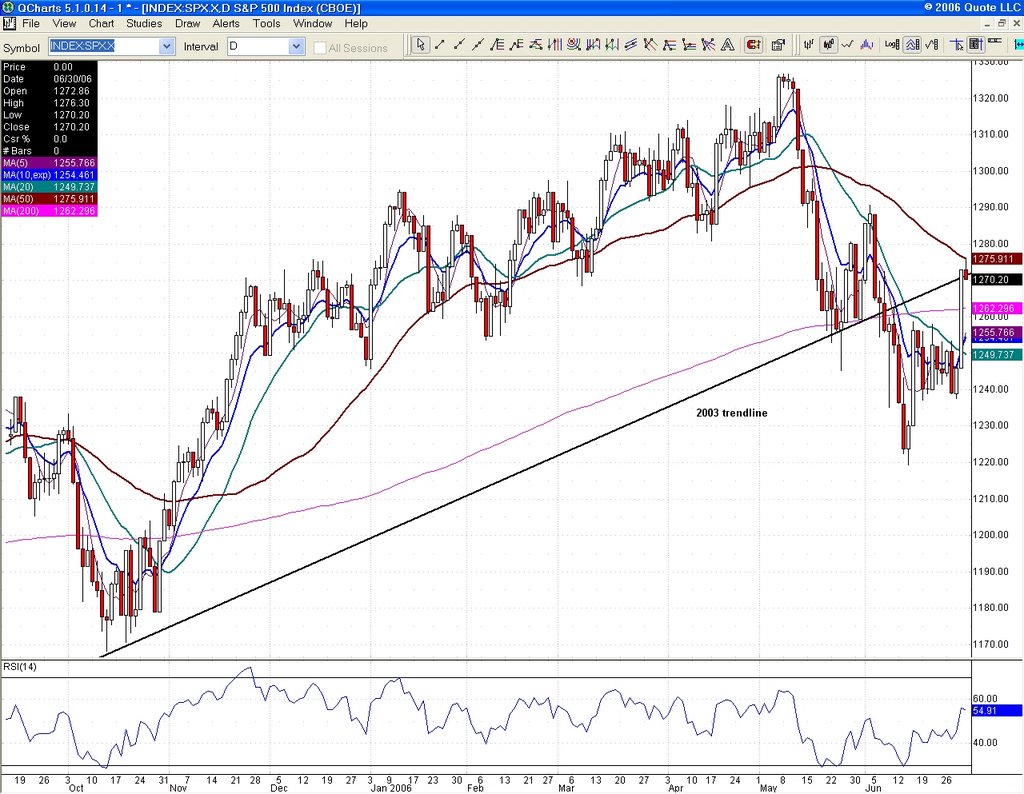
Two key charts going forward: SPX and NDX. The first, as you can see closed slightly below the old 2003 bull trendline it had lost in the past weeks as well as a hit and sell off of 50 dma. The second, paused right below the 20 month moving average in an impressive late month comeback, but prints a doji, a perfect reflection of the uncertain times the markets are facing. Time will tell, but watch these two significant crossroads.
This entry was posted
on Saturday, July 01, 2006 at 9:40 PM.
![]()
![]()