AheadoftheNews Blog

A blog on market moving news and futures trades.

Thursday, August 31, 2006

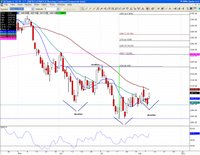
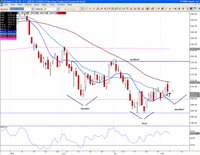
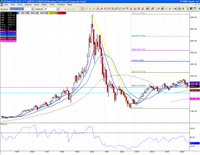
NDX and QQQQ close August below their respective 20 month moving average. Granted, it was close, but nevertheless that will mark a first since 2000 that we perform this feat for three consecutive months (after a bull run). The saving grace for techs will be the COMP which managed a close above.
As much as I want to discard this as an anomaly which will be quickly corrected, I don't have to remind readers that the NASDAQ 100 is a bellwether index. Let's see what happens in the coming weeks and how big firm trading computers will react. Exercise caution and above all, patience. For QQQQ, we need to consistently start closing above 39 and for NDX it is 1584. The good news is that puts are building at the 39 strike and that could be supportive in September.
The docket is loaded tomorrow with the jobs report pre-open, followed by consumer sentiment, construction spending and ISM. Expect some serious volatility early on, which could taper off into a flatline as the session closes.
Link

Tuesday, August 29, 2006

I have shown this chart a few times over the past couple of months. Here it is again, a historical juncture in a few days. NDX must close the month above the 20 month MA at 1583.

Monday, August 28, 2006

I want you to keep a close eye on VXN (NASDAQ volatility). It is somewhat stretched to the downside and that can be dangerous for tech stocks. We have had two days of hitting the lower bands of the envelopes I use and that always makes me a little nervous, or at least in a profit taking mood. VXN 17 seems to be the number where NQ and QQQQ stumble, happened Friday and happened today. We probably will get a spike soon, watch 18.90 if that happens.


The legs are buckling for oil and gold bulls. If 620 breaks, next support for gold is 616 followed by 604/605. Oil has immediate risk to 69.50, but we have to see what Ernesto does when he hits warm water again. The longer he stays on land (Cuba), the weaker he will become. Currently, CL/QM October is sitting right above 61.8% projection July, must hold at 70.30.
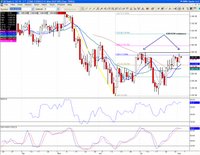
As for equities, nice pop, but NQ found some pretty strong resistance right below 1580.75, weekly R1. Its gap from last week is not closed yet, and since we are currently trading in that gap (1570.75/1585), watch the fibs I put up on the chart. Should bulls really get carried away, we could see NQ 1620 by week's end. But first things first, they need to move up above 1585 and soon. ES did in fact close the same gap but has resistance at last week's high of 1307.75. Nevertheless, quite surprising strength for ES given the weakness in energy stocks.
We have some market moving retail sales data pre-open and post-open the always eagerly awaited consumer confidence number at 10:00 AM. My feeling is that the price of oil will continue to dictate trade as it is the forward looking indicator for consumer health at this point, so watch out for the swings.
Link

Sunday, August 27, 2006
Just not the same party as last year for oil bulls. Oil drops .575 at the open of trade. Support is at 71.50.

MIAMI (Reuters) - Hurricane Ernesto was downgraded to a tropical storm on Sunday when its sustained winds fell below 74 mph (119 kph) as it moved through the Caribbean Sea south of Haiti.

But forecasters said the storm could become a hurricane again and emergency managers issued a hurricane watch for the low-lying Florida Keys, alerting residents to expect Ernesto to bring storm conditions to the 110-mile (177-km) island chain within 36 hours.

Aug. 27 (Bloomberg) -- Tropical Storm Ernesto was upgraded to hurricane status, becoming the first named hurricane in the Atlantic this year, as it gathered strength passing through the Caribbean Sea toward the Gulf of Mexico, a U.S. forecaster said.

BP Plc and Royal Dutch Shell Plc, Europe's two largest oil companies, yesterday evacuated non-essential personnel from their production and drilling operations in the Gulf of Mexico as Ernesto approached. As of yesterday the companies' Gulf operations were not disrupted, they said.


So far, no oil production delays, but CL/QM futures could gap higher and put a chill on the equity markets tomorrow. Watch gold as well at the open of trade this evening. These are the types of events that skew charts, but keep in mind that everyone is seeing the same news and it might be wise to stand aside. If Ernesto turns out to be non-disruptive, or smart money sees it that way, any oil rally could be short-lived. Nevertheless, the fear could keep a floor in. 74.80 is resistance and the number to watch on a spike up.

Saturday, August 26, 2006
(State College, PA) - Tropical Storm Ernesto is gaining strength and may become the first hurricane of the 2006 Atlantic Hurricane Season in the Caribbean. From there, the system seems destined to track into the Gulf of Mexico later next week.
Link
Those who went long oil at the close on Friday might have placed a good bet. Let's see what develops tomorrow before the Nymex open.


As I mentioned Thursday, we have to keep a close eye on oil and there are two immediate threats next week. One is Ernesto Link and the other is Iran and the August 31 deadline. Friday will also see the non-farm payrolls for August. A traders market: buy support sell resistance and keep those stops tight and above all, don't get greedy when you have a winning trade. But the bottom line remains that we have improving technicals and a constant wall of worry, which theoretically should give us more upside.
Since oil is on everyone's mind, let's get back to the chart. As you can see, 73.50 acted as resistance on Friday (see my post on Thursday) and oil bears even managed a close below the 10 dma. The same resistance applies on Monday, but if Ernesto starts building, we could see a move to the next resistance level which is now 74.50/74.70, confluence 50 dma, 20 dma and 38.2% latest correction. I think that will be a pretty solid wall and a good place to take profits if long oil and maybe even start legging in to some shorts, although that should only be for experienced traders. As you know, my medium term view on oil is bearish, I think we will drop to the low 60's October. But for now, we trade what we see.

Friday, August 25, 2006

The prize this month would be a close for NDX (Nasdaq 100) above 20 monthly moving average, now at 1583. It has been resistance this August, and bulls need to make it happen. Conditions are ripe for a continuation of the rally, so keep an eye on that number for comfirmation that the worst is over short term.

Thursday, August 24, 2006

The short term stumbling block is going to be the rise of oil from oversold conditions. Taking the currently traded October contract of light sweet crude, we can see risk to 73.45/73.50. This is a technical bounce more than anything, but keep in mind the risk of breaking out of the bear flag to test 50 dma around 74.75. A failure at 73 keeps the downtrend firmly in place.

WASHINGTON (AP) -- Sales of new homes dropped in July by the largest amount since February while the inventory of unsold homes climbed to a record high.
The Commerce Department reported Thursday that new home sales fell by 4.3 percent last month to a seasonally adjusted annual sales pace of 1.072 million units. The decline was the largest since an 11.5 percent plunge in February.


The durable goods number was bullish for tech, so that is offsetting bearish sentiment on the upcoming housing numbers release. Since the bearish side of durable goods was linked to higher fuel costs (transports), the price of oil will play a key role going forward.

Aug. 24 (Bloomberg) -- Declining demand for aircraft and motor vehicles pushed down U.S. durable goods orders last month, according to a government report that also showed resilient spending on business equipment such as computers.

The 2.4 percent decrease in durable goods orders followed a revised 3.5 percent increase in June that was larger than first reported, the Commerce Department said today in Washington. Boeing Co., the world's second-biggest commercial airplane maker, said it received fewer bookings last month than in June.

Orders excluding transportation equipment rose 0.5 percent, more than forecast and the third straight increase, suggesting manufacturing remains a bright spot in the economy.
Link


The one nagging question I have for now is the VIX and the fact that it is sitting near the lower part of the envelope I use against the 10 day ema. As you can see from the chart, we have upside risk to at least 12.79 and possibly 14 on some more extreme selling. The QQQQ gap from August is not closed yet, so keep an eye on 38 support. If that fails once again, we will see a move down to 37.70, or close. Watch NQ 10 day ema at 1551.75 for overnight futures support. For now, we seemed to have found reasonable ground, but play it tight.
Lots of data coming out this morning, including jobs, durable goods and new homes. Bonds seemed to have factored in some pretty bearish (bond bullish) news. We could have a surpise somewhere, which could lead to some equity relief. Lots of tug and pull as we work off some excesses in both bonds and equities.
Link

Wednesday, August 23, 2006
NQ finds support at 50 day ema and SMH holds on to 10 dma. We could have seen the lows on this pullback, at least for today. QQQQ briefly went into the 37.70/37.99 August gap and rallied out of it.

Tuesday, August 22, 2006

Fool's gold? With oil falling, dollar strengthening and inflation under the scrutiny of a possibly hawkish Fed, you have to review how much upside we have left short term. Support is 50 dma at 633.60 (December contract), it needs to hold or the bear flag is confirmed.

If you were wondering why Texas Instruments (TXN) took a hit right after the close, look no further than NSM:

Aug. 22 (Bloomberg) -- National Semiconductor Corp., whose chips amplify sound in wireless phones, cut its revenue forecast because of lower-than-expected sales to mobile-phone customers. The shares dropped 7 percent.

Sales in the fiscal first quarter ending Aug. 27 will fall about 6 percent from the previous period, the Santa Clara, California-based company said today in a statement. That compares with a June forecast for a decline of 2 percent to 3 percent.
Link


The one index that has not violated its supporting trendline off October lows is the Dow Jones Global Titans Index (DJGT). These are large cap multinationals and you can clearly see where the money has been going: out of small caps and into the big guys. But even for this bullish beast, we are reaching the top of the channel so a pullback could be in order.

Oil falters at exactly 73.50 and stocks catch a bid. NQ and ES gap closes are 1585 and 1307.50 ( we are close enough) and we could ease off now ahead of the big housing numbers on Thursday. Watch NQ 1570.75 support.

Crude oil has reversed and is catching a bid. As discussed earlier, watch 73.50 (38.2%) and further up, 74.70, 50 dma (October contract).

Monday, August 21, 2006
This is truly an amazingly well researched piece:

Pause, Not a Recession . Link


COMP 2326? We hold above that neckline, it could be the end zone. 100% projection inverted head and shoulder. For now, overbought conditions could have us test support, currently around 2115/2120.

Good news for PC companies:

Aug. 22 (Bloomberg) -- Microsoft Corp., the world's biggest software developer, is in talks with personal-computer makers and retailers to offer discounted upgrades to its Windows Vista operating system to help bolster holiday sales.
Link

I'm getting bearish on oil. I know, it's heresy, it can't be, etc...But hear me out. The failure at 50 dma was pretty brutal last week and we hit support with a bearish RSI divergence. Furthermore, the technicals are deteriorating but everyone is still screaming buy oil and oil stocks. Exactly the opposite of equities where improving technicals is met with pessimism. You know how I feel about that. Notwithstanding the macro conditions related to a slowing economy, one must start to believe that a lot of bad news has been thrown at oil and must be reflected in the price. The caveat is another Katrina or war with Iran, but this is not the kind of odds you take to Vegas.
Futures trading has switched to the October contract (CL/QM 06V). Coincidence or not, it is the only contract to hit 80 (exactly) as the year high. We did a perfect bounce last week off 71.48, 50% 2006. As you recall, I had a September contract chart up back then and called for a drop to around 69.50, which is pretty much where we found a near term bottom. If bulls fail to regain the 50 dma, now at 74.70 (October contract), the party lights go out and it could be for the remainder of the year. Let's wait for that failure first before committing anything on the short side, but longs should be aware of the dangers lying ahead. It is not a slam dunk that oil will keep rising without a deep correction at some point. The first order of business for oil bulls will be to regain 73.50, 38.2% 2006 and above all hold on to 71.50. The press is still quoting September, that's not what traders are using. There is about a one dollar premium on the October contract compared to September. Of course, near-term bearishness is negated on a move with volume above 74.70. Shorts be patient, longs be careful.

click on chart for full size

Monday set up: traders should note the relative correlation between weekly pivots and daily S2 for both NQ (1254.50/1258) and ES (1292.75/1295.25). QQQQ would be 38.08/38.16, but be mindful of that gap below.

Sunday, August 20, 2006

It's pretty straighforward now: QQQQ needs to hold its 50 day moving average at all cost. Right now, the chart is looking bullish, with the 10 dma about to cross the 50 dma for the first time in months. We are also short term overbought. There is a gap to close at 37.70, should we lose 50% projection July at 38.21. Note also the ex-trendline resistance now support around 38.30/38.40.
I put up QQQQ, but NQ has the same parameters. Semis and SMH will be your lead player in this, so watch them carefully. As you know, I think this rally has legs all the way into Labor day, but as usual, we will let the charts tell us what's cooking.

A look at GOOG again, now that the media is catching on:
Aug. 18 (Bloomberg) -- Wondering why your investment in Google Inc. has lost 18 percent of its value since the shares peaked at about $475 in January? Relentless stock sales by the Internet search company's executives might be to blame. Link

It's in the charts as well. Last Monday, I mentioned the following: ...unless GOOG moves back up above 385 rather quickly, there could be trouble ahead. The big pie on the sky for bears is the October 2005 gap close at 303, but they will need to get the stock below 340 for that to come in play. Nevertheless, GOOG is at a critical spot right now...

Not much has changed for GOOG and that is a red flag. It cannot get back above 38.2% 386.39 for very long and even though we have been bouncing off the 20 day moving average, GOOG is one of the lagging large cap tech stocks that has not reconquered its 50 day moving average in last week's rally. That is bad news for GOOG. In fact, any tech stock that did not follow QQQQ/NDX/NQ and SMH back up above the 50 dma last week is in trouble. The stock is a darling of momentum traders, but if they decide to drop it, look out below. Key support is 368. A strong close on volume back above the 50 dma at 394 negates the bearishness.

Friday, August 18, 2006
Interesting interview of Shiller from Yale on the housing market. It also gets in to the new housing future's instruments, which incidentally are predicting a further drop of 5% by next year. In essence, Shiller is forecasting a recession by 2008. Link


QQQQ has that gap below between 37.70 and 37.99 that could be tested next week if ex-trendline resistance at 38.30, now support, does not hold. Opex Fridays are tricky, so mind your step today. On a broader pullback, I like SPX 1285/1286.

Thursday, August 17, 2006
We knew that.

Aug. 17 (Bloomberg) -- Federal Reserve Chairman Ben S. Bernanke's gamble that he can suspend interest rate-increases on the chance inflation will recede is showing signs of paying off.

Economic figures are now breaking Bernanke's way for the first time since he took the central bank's helm in February. A measure of wholesale prices unexpectedly fell last month and one gauge of consumer inflation eased, Labor Department numbers in the past two days showed. Reports of slowing sales from Wal-Mart Stores Inc. and Home Depot Inc. provided evidence backing the Fed's forecast of a slowing economic expansion.

The data blunt criticism that Bernanke, 52, is softer on inflation than his predecessors Alan Greenspan and Paul Volcker, and that he jeopardized the Fed's credibility by refraining from lifting rates last week.
Link

We pretty much reached my target for the rally this week near QQQQ 39 ( see previous posts) and that was the zone to take money off the table for this week. Now it's time to wait for a pullback and get in for the next leg up, should support hold.

Wednesday, August 16, 2006

I mentioned a few days ago that oil was a sell below 74 and it sure took my word for it. Here as well, if you stayed with the crowd too long, you got hurt. The combined loss of 50 dma, trendline support and 61.8% pretty much ensures a retest of June lows near 69.50. Immediate resistance is 71.85. QM/CL is very fickle to trade, but when it gets on a course, it just keeps going like most commoditites. Oversold conditions will soon produce a bounce, but failure to regain 73.40 should result in more downside. Oil bulls need a hurricane now. On the subject of hurricanes, keep an eye on these formations: Link


Bears got in trouble again today. If you play with the crowd, expect to get trampled at times. Sentiment was so universally bearish, you knew something like this was bound to happen.
We are fast approaching some short term resistance. QQQQ has a gap to close from July 3rd at 39 and with call resistance between 38 and 39, we could be near a top for this week. Next week is a different story. COMP has broken out above the June descending trendline resistance and neckline of inverted head and shoulder (see my previous intraday post) SPX is back above 2003 bull market trendline (chart). Support is at 1285/1286 and if we hold that going forward, there is actually (heresy) a chance that we might retest 2006 highs if we get a close above 1301.22, which is not a given since we have failed there before. Nevertheless, quite a turn of events. In any case, if we settle above 61.8% 2006, it will be hard to keep calling this a bear market. Before one gets too excited, let me remind you that in 1987 we did exactly the same thing: a tough correction in the spring and a rally to new highs in the summer followed by a collapse all the way into December. I'm not saying we will repeat this scenario, but if we hit new highs in the next few weeks and everyone gets too optimistic, I would step aside. For now, there is room to grow. The weekly oscillators have some air above and the sentiment is cautiously optimistic with enough of a wall of worry to keep us going.

Oil inventories coming up in 20 mns. Equities cannot afford to see a spike in oil prices at this juncture. Market moving.


NASDAQ (COMP) also closed above its 50 dma yesterday, a big first as well. It is now hitting against the trendline on what now appears to be a confirmation of the inverted head and shoulder I wrote about last week. Keep an eye on that thick black line. A close above sets up a much higher move in the future, minimum 2230, 38.2% projection from neckline. But we still have to close above 2125 for that to come in play.

The whisper number was at .2 for the core CPI and we hit it. Futures are solidly ahead pre-open. Keep in mind that NQ is already above weekly R2, so this move will be somwhat limited, but it is a relief and QQQQ/SMH should hold on to their 50 dma's. Gold is up 7 at 634 and that is of concern, but it is most liley tied to the fall of the dollar. Keep an eye on that and the 642 level. Gold could be a short if it fails there.

Tuesday, August 15, 2006
You have to wonder where bears will get their ammo going forward with all this pessimism. This website's page is actually quite amazing in its complete lack of bullishness: Link
Don't get me wrong, there is huge risk with CPI tomorrow and after big rallies like today, there is often some selling even in a bull market. But you have take media sentiment into account. It tells you how much of the bad news or good news is priced in. Right now, even though QQQQ and SMH closed above their respective 50 day moving averages for the first time since early May, the pundits keep scaring us away. That is the exact definition of a wall of worry: pessimism in the face of improving technicals. I remember how the media was telling everyone to buy in 2000 when the bottom started falling out. I'm not getting the same feedback this time around. Personally, I will wait to see if this rally fails before jumping to bearish conclusion. It's pretty cut and dry: QQQQ needs to hold the 50 dma at 37.37 and semis will be the canary in the mine. Pre-open, it will be NQ at 1532 and the numbers for gold I gave you in the last post. Could we fall apart tomorrow? Absolutely. Could we hold ground? Yes. Price is what matters now, nothing else.


Profit up 39%, sales jump 56% at Applied Materials Link
AMAT delivers after-hours, confirming the bullish tone of the SOX today and reinforcing my feeling that the place to be going forward is tech, should interest rates not go up and oil keep heading down or stabilizing (see my post Wednesday August 9th). We have a very dangerous and potentially disruptive piece of data pre-open with the CPI numbers, but anything in line or below will keep the rally alive. QQQQ is approaching an area of call resistance, but if shorts need to cover some more, we could approach the July gap at 38.64. Of course, an inflationary CPI number will end this rally rather quickly. Watch gold futures (October contract) and the 626 level of support (chart). A break above 642 would signal that inflation fears are back and a loss of 626 support would reinforce today's mild PPI core reading. We are currently resting at 38.2% May/June (629.20).


COMP is above 50 dma as well and it looks like we are confirming that inverted head and shoulder, which would set up a test of 2130 or so if we hold 2099.


SMH (semiconductor ETF) moves above 50 dma, a first since May. Again, watch that level (31.70).

CPI tomorrow is what matters the most, since many government disbursement, including social security, rely on it for either an increase or not. It is in the interest of the government to work the CPI numbers as low as possible, so you have to go to commodities to judge true inflation and gold is it. Right now, it is saying inflation is not a problem, but keep a look out tomorrow. Gold (October contract) has support at 626.50, 50 dma. A break below confirms that inflation fears are unfounded, but if we hold that, it means smart money doesn't buy it.

The core PPI does a surprise drop, down .03, and we get a rally. If the CPI does the same thing tomorrow, it will pretty much quiet down those clamoring for more rate hikes. Who are these guys anyway? Have you noticed higher prices? I havent. In fact, buying a computer has never been this cheap.
There's volume behind this one, let's stick if it sticks to the upside. The concern is too much slowdown now and that can keep a serious wall of worry going, one that might be too much to overcome in the summer. Techs keep leading the charge, no surpise there for those who follow my viewpoint on this. SMH (semis) at 50 dma, watch that one for any sign of failure or breakout (31.70). NQ weekly R1 is at 1520.
Link

Monday, August 14, 2006

Unless you have a nice cushion or are present to trade it, you shoud be flat futures overnight with PPI due pre-open, It's market moving and we will get some volatility. NQ support is 1497.50, 1492 and 1488.75. ES support is 1273.50, 1270.75 and 1266.50. Bears regain full control on an ES close below 1266.50, 50 dma.
Link


Nice close for the semis, with SMH holding above 31.11, 10 dma. Resistance is 31.23, 50% July, so the range is tightening. This is summer trading so buying support and selling resistance works and hoping for a clear trend doesn't. In other words don't get married to either side, long or short. However, if SMH can hold above 30.80/31, the bias remains slightly bullish. Keep on eye on oil and rates.

Sanford Bernstein calling for sharply lower oil. Link
I tend to agree that there is hoarding and hedge fund activity that could unravel. The sector sentiment is excessively bullish. Technically, today was a bad day for oil, with a failure to regain the 50 dma and trendline lost on Friday. September crude is a sell below 74. Keep in mind of course that any bad news could trigger a resumption of the rally, so shorting such a volatile commodity is very risky. I would prefer to just avoid the sector for now.

September unleaded gasoline drops 3.85% to 2.05. Let's hope they pass this along to the pumps soon. NQ holds on to 1501, weekly pivot. SMH (semiconductors)finds support above the 20 dma at 30.80, which techs need to hold. Resistance is at 31.10.


Gold futures (YG October)dropping along with oil. Key support now lies between 627 (50 dma) and 629 (38.2%). Resistance is 641, 20 dma.

Sunday, August 13, 2006

Oil loses supporting trendline and 50 dma (see chart) on the cease fire news from the middle-east. This could trigger an overnight rally. Remember that we have key inflation data Tuesday and Wednesday. Watch NQ 1497.50 20 dma support. Pivot is 1494.50 and weekly pivot is 1501. ES support is 1272/1274.


The Google (GOOG) gaps are coming back into view. The stock paused Friday at the March 2006 gap open of 368.62, but should that support break watch for a potential gap close at 341.89. The August bear flag was confirmed and unless GOOG moves back up above 385 rather quickly, there could be trouble ahead. The big pie on the sky for bears is the October 2005 gap close at 303, but they will need to get the stock below 340 for that to come in play. Nevertheless, GOOG is at a critical spot right now. 365/368 needs to hold on Monday. A closing move above 385 negates the bearish scenario. Of note: for the first time ever, the 50 dma has crossed below the 200 dma. Bulls need to come to the rescue and fast.

Let's take a look at NDX (Nasdaq 100) weekly chart. There is lots of confusion out there and certain basics need to be examined. The 10 weekly moving average (blue line) has been acting as resistance since the week of May 7th. Currently at 1518.85, it holds the key and hope for bulls. Drawing a fib retrace from August 2004 low, we get 61.8% at 1477.47, not coincidentally the double bottom of the past two weeks. There is no doubt now that a break below 1477 sets up a test of 2006 lows (1446.77) and further down the 200 weekly MA at 1426. We are not there yet, however set your stops accordingly. Conservative traders might want to wait for a move above 10 weekly MA before entering any long positions. QQQQ has rather large put support at 36, so we should hold that level during this coming option expiration week. On the other hand, should we break below 36, put sellers will get squeezed and have to cover by shorting the underlying. That is the nightmare scenario we experienced in May and I certainly hope we don't see that again. Volatility sellers have been getting a little bolder leading up to this week and they will do anything they can to make your puts (and calls) expire worthless. Less see if they succeed.

click on chart for full size

Friday, August 11, 2006
Mark Hulbert:
As of Thursday night, the HSNSI stood at 15.6%, more or less right in the middle of its historical range from minus 81.8% on the low side and 79.7% on the high end.
I consider the HSNSI's current reading, on the whole, to be positive for the stock market's near-term prospects.
Link

On the same note, Investor's Intelligence survey's latest reading shows a bull/bear ratio that has started dropping again in the past few weeks: Link

The hope for bulls lies in the semis and that is taking a hit today with the Analog Devices news. SMH needs to hold 30.77. The markets are like a hysterical child right now, worrying about higher retail sales and the Feds. But Bernanke cares more about Jobs right now. He has his soft landing, I don't think he will mess it up especially if job growth stalls. So all in all, more nonsense but we have to live with it for now.


Retail sales came up stronger than expected, confirming the bullish numbers from Target, JC Penney and Kohl. This in turn is awaekning Fed fears again and giving oil a boost as the consumer seems healthy enough. This news should be considered bullish, especially for electronics, but there is always someone worrying about something. What nonsense. As for Oil, it bounced off trendline support and 50 dma (73.95), but it is within an ascending wedge, so the pattern is ultimately bearish. Watch resistance at 76.125, 50%, should we get past 75, 20 dma. A break above 77 negates the current bear flag and sets up a move to 80.50, but that is not in the cards yet. In fact, failure to get above 75 should be shorted.
NQ (NDX e-mini futures) has support at confluence pivot and 20 dma (1496). Definite line in the sand for NQ is now 1488.75, 61.8% and current 30mn bband support. Bulls cannot afford a third test of weekly S1 at 1486.25.
Link

Thursday, August 10, 2006

SMH (semiconductor ETF) holds the key. Closed right at 61.8% (31.74). Must get a close above 50 dma soon. RSI has more upside and the trend is up, so we should get another go at it soon. 30.80 is the line in the sand.

Stocks need to get a move on it and fast. I am bullish on techs, given the performance of the SOX, but it seems we just can't get out of bed, although today was certainly a nice show of resilience. Multiple articles on the demise of the bull market, so expectations are low if non-existent. I am still betting on a push in August/early September, but it needs to happen soon, or we will lose key support levels out of sheer inertia. I want to see SMH (semi-conductor ETF) hold 31.20 going forward and breakout above 50 dma at 31.89. Keep those stops tight. So far the bullish trades have been working well with NQ, thanks to the SOX, but it has been a flip-flop affair and profits must be booked almost on a day to day basis. We are still in the midst of the post-fed news trade, but once we clear this week, bulls should hit the overdrive button. They need to.

SOX, technology in general and small caps lead the charge. NQ (NDX e-mini futures and QQQQ proxy)finally did a move above 1495.50, 20 dma. Support is: 1495.50, 1492, 1488.75 and 1486.25. Below that stay flat or short. Resistance is 1498.50, 1503, 1506, 1512.75. Gasoline futures down 4%, retailers up 1%. Noticing a definite rotation out of commodities and into technology/retailers ahead of back to school and positive IT spending news. The pre-open news was good, the only bad news was something that did not happen.

NQ 20 dma at 1495.50 is still resistance. ES having a rougher time thanks to dropping energy stocks.

NQ holds August lows. Weekly S1 is 1486.25, watch that level now. The SOX stays on its bullish course. Beware of headfakes.

The news from London is overshadowing some pretty good news on the corporate front. IBM does a merger, Target and JC Penney are posting strong sales and the trade deficit narrows. This is probably why US futures have not fallen further. Watch oil, as it took a major hit the last time terrorist news came out of London. But it's a different market now. We will see. Watch NQ 1483 and ES 1262 key support areas. The SOX has been bullish lately and I bet it will show more relative strenght today, at least initially.

Aug. 10 (Bloomberg) -- Target Corp., the No. 2 U.S. discount chain, said second-quarter profit rose 13 percent on higher food sales and revenue from the company's credit-card operations.

Net income rose to $609 million, or 70 cents per share, from $540 million, or 61 cents, a year earlier, beating analysts' estimates. Revenue increased 11 percent to $13.3 billion from $12 billion, Minneapolis-based Target said today in a statement.
Link

Aug. 10 (Bloomberg) -- J.C. Penney Co., the third-largest U.S. department-store company, said profit increased 37 percent, helped by sales of women's accessories and jewelry. The company lifted its full-year forecast.
Link

Aug. 10 (Bloomberg) -- International Business Machines Corp., the world's No. 2 software maker, agreed to buy FileNet Corp. for about $1.6 billion in cash to add software that helps businesses handle management procedures.
Link

Aug. 10 (Bloomberg) -- U.K. police foiled a plot to blow up airliners bound for the U.S. in a series of terrorist attacks the government said might have been deadlier than the Sept. 11 bombings of New York and Washington.
Link

Wednesday, August 09, 2006

Stay with techs when the SOX exhibits relative strength. NQ did a clean bounce off of 61.8% (see 60 mn chart)and as long as we hold that level and semis keep their chin up, the markets will come to. Don't get confused by weakness in cyclicals.

The lousy numbers from TOL hurt at the close, but note that techs are still doing better than the rest of the broad market. SOX closes up .82%, at 409.05. QQQQ and NQ are holding on to their 20 dma's and that is a positive. Other indices look tired.


Right shoulder on COMP inverted head and shoulder is pretty much in place as it pops out of a potential bear flag. I had raised that possibility a few days ago, here is confirmation if the lows hold. Neckline is around 2180, projected upside target would be 2350 on a breakout above neckline. First things first, we need to get above 50 day moving average at 2109. Nevertheless, technology is the place to be going forward.


Here are monthly charts of TOL ( Toll Brothers: new home builders) and COMP (NASDAQ). Look at the parabolic rise of TOL from 2002 to 2005 and the identical pattern in the NASDAQ from 1997 to 2000. Anyone that still puts forth the theory that housing was not in a bubble and is not experiencing a severe correction is, to put it mildly, in denial. The TOL chart clearly shows more downside ahead for the housing market. The stock is trading at 24 today, it was at 10 in 2003. More pain ahead for that sector.

Tuesday, August 08, 2006
Pretty much what I thought would happen (see Sunday post). Markets sold off on the news but on low volume and SMH (semis) held on to 20 dma support. NQ did a double bottom of sorts off August 1 low. CSCO delivered after the bell and we should get a real rally going soon. The nagging question is oil, but inventories are due tomorrow. Oil and gold finished down today. Seagate is offsetting the CSCO good news, but the overinght session still looks favorable. Watch NQ 20 dma at 1495.50.

Monday, August 07, 2006

Is the COMP building an inverted Head and Shoulder with the right shoulder being formed now? Keep an eye on this potential bullish development, it could be crucial going forward.

Higher oil and a pervasive negativity ahead of the Feds is keeping a lid on any rally. Support is holding so far, but it is very tentative. The buzz is that the Feds went too far and even if they pause, it will not be enough to get things going again. Bears keep climbing and bulls keep dropping in the latest Investor Intelligence survey:
Link

Sunday, August 06, 2006

Since I think technology is the sector to rotate into ahead of back-to-school, let's take a look at SMH (semi-conductor holders) The chart is becoming somewhat bullish. We broke out above a three month descending trendline and have pretty much held on to the 20 day moving average since. Resistance is very clear at 50 dma (32.10). Confluence 10 dma and 20 dma at 30.75/30.85 is what needs to hold going forward, but there is wiggle room down to about 30.38, an area I would call the line in the sand for bulls. Should we break out above 32, the July 3rd high at 33.43 is next resistance, followed by the 200 dma at 35.75.
My bet is that the markets will initially drop after the Fed pause announcement (if they do pause, but at his point, there is nothing to indicates otherwise). This is due to the perception that the economy has become too weak and as we saw Friday, cooling economic news is no longer welcome. But I think investors are ready to drive this one higher once everyone calms down. SPX average p/e has dropped from the twenties to the mid teens and we now have room to pump up prices. Of course, there are quite a few folks that think Bernanke has gone too far and that we are headed for a recession. I don't buy that. Yet.


The jobs numbers on Friday was the last nail in the coffin for those inflation wackos dreaming of another rate hike. With futures showing less than 15 percent chance of such an occurrence, we can pretty much rest assured Bernanke will pause. I think he will make some hawkish comments just to appease some, but the bottom line is that the economy cannot afford higher interest rates. In fact, we should see some easing later in the year.

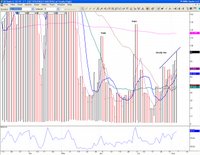
How will the markets react? Hard to say. Most are predicting a bounce that will fizzle out. I am not so sure. It will all depend on the pre-event reaction and the sentiment leading into it. We could very well have initial selling, just to flush out the weak hands. But after he dust settles, August could be quite bullish with a sustained rally that could surprise many. The NASDAQ new 52 week highs is getting some upward momentum just as the new 52 week lows flattens out and drops. If you look at the chart of new 52 week lows (chart 1), you can see how May and July had short lived lows that looked like typical bear market headfakes. The drop in new lows the past ten days no longer fits that pattern: it has not gone as far, but notice how bears are unable to press on. If we turn to the NASDAQ new 52 week highs (chart 2), we can see a steady rise, as opposed to the previous one or two day events. Watch this pattern, it could be the proverbial canary in the mine.

Friday, August 04, 2006
Some fear showed up late morning, but bulls managed to rally at the close and NQ held the all important 20 dma while ES is back above 1285, 50% 2006. Retailers were up .59%, financials +.73%. The ten year swings down to 4.9%, which is good news for equities going forward. Bernanke better pause, or the markets will free fall.

If you were not swayed by Al Gore and "An Inconvenient Truth", read this analysis by the former head of planning for Shell oil, Peter Schwartz.
Link

Watch those morning gaps. NQ should find buyers at 50% gap around 1525. 1521/1522, gap close and previous high resistance is must hold at this point. Bias is solidly bullish above.

The deal is pretty much sealed, Bernanke should pause next week. ES has broken out above 1289 and as I commented a few days ago, is headed for 1299/1300. NQ and QQQQ should also test their respective 50 day moving averages (1549 and 37.70). NASDAQ is finally showing more new 52 week highs than lows (70/33)and semis are leading the charge.

Aug. 4 (Bloomberg) -- Employers in the U.S. added fewer jobs than expected in July and the unemployment rate climbed, making it easier for the Federal Reserve to refrain from raising interest rates next week.
Link

Thursday, August 03, 2006

QQQQ hits 23.6% 2006 (or 76.4) and backs down, just like a few days ago. That will be the resistance going forward (37.37). Eventually, there is little doubt we will get up to that gap just above 38.50.

Wednesday, August 02, 2006

ES (SPX e-mini futures) is bumping up against 1289 resistance. Should it manage another move above 1285.75 (50% May decline), the upside breakout could happen and we would see a move to 1300 very quickly. Critical support has moved up to 1272/1273.

Are some perma-bears getting desperate? In this article, one of them suggests the recent stock market rally is manipulation by the government ahead of elections. Even if that's so, why stay in the way? Enjoy the ride for now.
Link

Fascinating article on the Asian rise of sprawling airports and metropolis. America, beware. The competition is heating up.

Rise of the Aerotropolis: as competition shrinks the globe, the world is building giant airport-cities. They look monstrous to American eyes--and that could be a problem. By: Greg Lindsay. Link

The name wasn't terribly auspicious: Nong Ngu Hao, the "Cobra Swamp." But the location, a mammoth piece of ground in the sparsely settled landscape between Bangkok and the southern coast, was nearly perfect. Thailand's leader at the time, the visionary-if-dictatorial field marshal Sarit Thanarat, had chosen this spot to build his country's bridge to the 21st century, in the form of a gleaming international airport. It would be a long time coming.

The field marshal died suddenly in 1963, and the airport was postponed for decades; meanwhile, Thailand's neighbors either eviscerated themselves or else offered up their cities as the First World's factories. By the time the 21st century actually came into view, the field marshal's democratically elected heirs watched enviously as the Dells, Seagates, and Motorolas of the world parceled out pieces of their sprawling supply chains across Indochina, creating hundreds of thousands of jobs for lottery-winning cities such as Kuala Lumpur and Singapore.

But before the end of this year, on a still-soggy tract that now lies at the creeping border of Bangkok's suburbs, a new $4 billion mega-airport will finally open, forming the heart of a nascent city. When it's finished, the erstwhile Cobra Swamp, now Suvarnabhumi (the "Golden Land"), will pump more than 100 million passengers a year through its glass portals, about as many as JFK, LaGuardia, and Newark aiports combined. Within 30 years, a city of 3.3 million citizens--larger than Chicago now--will have emerged from the swampland.

To the jaundiced American eye, such a project might appear to be the terminal metastasis of the sprawl represented by O'Hare, LAX, or JFK. But to dismiss it as the product of Asia's infatuation with all things mega would be to miss the carefully calibrated machinery underneath. It's a machine U.S. companies ignore at their peril at this time of escalating global trade and frictionless competition. It even has a name, the "aerotropolis," and a creator, John Kasarda.
Link

Oil is finding a real bid and it is putting the brakes on the opening rally. Watch those gaps today, NQ 1494.50/1497.50 and ES 1276.75/1279.50.

Bulls are back this morning, especially techs, which I think is the sector to start rotating into, contrary to popular belief. QQQQ 20 dma is at 36.69, keep an eye on that. A close above negates yesterday's strange low volume sell-off. Oil inventories at 7:30 (PST)hopefully will ease this latest run in oil, which is getting more attention thanks to hurricane Chris.
Link

Tuesday, August 01, 2006
It's a tough call here. SPX bounces off the 200 dma and most indices manage a close above their respective 10 day moving averages. But NQ/QQQQ lose 20 dma support and while the ten year note drops below 5%, gold makes a comeback with a move above 643 resistance. Inflation concerns, or riding the higher oil? Obviously, the bond market is not as concerned as the metals are. Oil inventories due tomorrow and we will take it from there. NQ (NDX e-mini futures)has confluence daily and weekly S1 at 1479 and that could prove to be an overnight lure. Keep a close eye on SMH (semis) and 30.50 support. COMP at 2058 is also a must hold.
The real data comes on Friday with the jobs report. I did not expect the markets to fall this hard before this key piece of information, but keep in mind that today's volume was light, with QQQQ at 78% normal. Summer trading often sees exaggerated moves and we will see if this one bites more than it barks.

Test of SPX 200 dma (1267.50).

Gold catches a bid, there is inflation concern. Look at 643 for support now.

Yeserday I mentioned YM 11124/11125 as possible risk, sure enough we hit it (close, 11127)and it should serve as support.


NASDAQ monthly chart. Watch 2058.16, 23.6% 2000/2002.

Keep an eye on gold, it is the best gauge of inflation fears. In my post yesterday, I discussed the 643 level of resistance. As long as the metal stays below, I will view bounces there as suspect.

Watch for critical support accross the board at 10 day moving averages. For ES, 1268.50, NQ 1494.50 and YM 11110.

The bear is back on inflation worries, nevertheless I think they will be more concerned with the jobs data on Friday. But for now, we have to suffer through the volatility:

The personal consumption expenditures deflator, an inflation measure watched by Fed policy makers, rose 3.5 percent in June from a year earlier. Economists expected a 3.3 percent increase, based on the median estimate in a Bloomberg survey.

Interest-rate futures suggest there is a 36 percent chance the Fed will raise rates to 5.50 percent from 5.25 percent when policy makers on Aug. 8. The odds were 31 percent yesterday. They were as high at 75 percent a month ago.
Link

Oil just dropped to 73.85 (August contract). When I commented this weekend on how preposterous it was to think oil shipments would be cut off because of this very localized war, I had no idea the markets would sell-off this fast, but they did. The September contract hit 79.40 and it was all over for oil bulls. This is bad for energy stocks but good for the consumer going forward.

Gold is telling us the Feds are most likely done. The bid in YG is unusual when oil drops, so this means gold is coming back as a hedge against inflation. If the Feds stop raising rates, inflation is a risk and gold will rally to new highs.

The same idiots that were upgrading TXN at 34 to buy a few months ago are now downgrading at 28. Do you ever listen to analysts? I don't.
YHOO has a 1.47 pc ratio at 30 and a little over 1 at 32.50. I would not short that stock ahead of earnings, odds are not good and you could get caught in a real squeeze tomorrow. Too much pessimism.