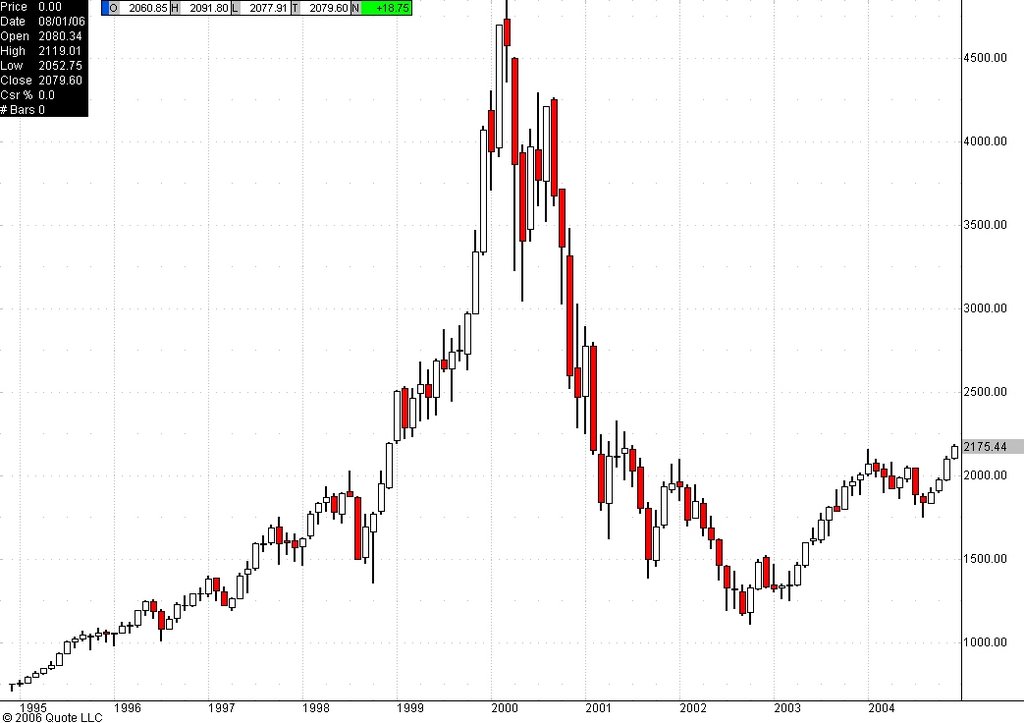
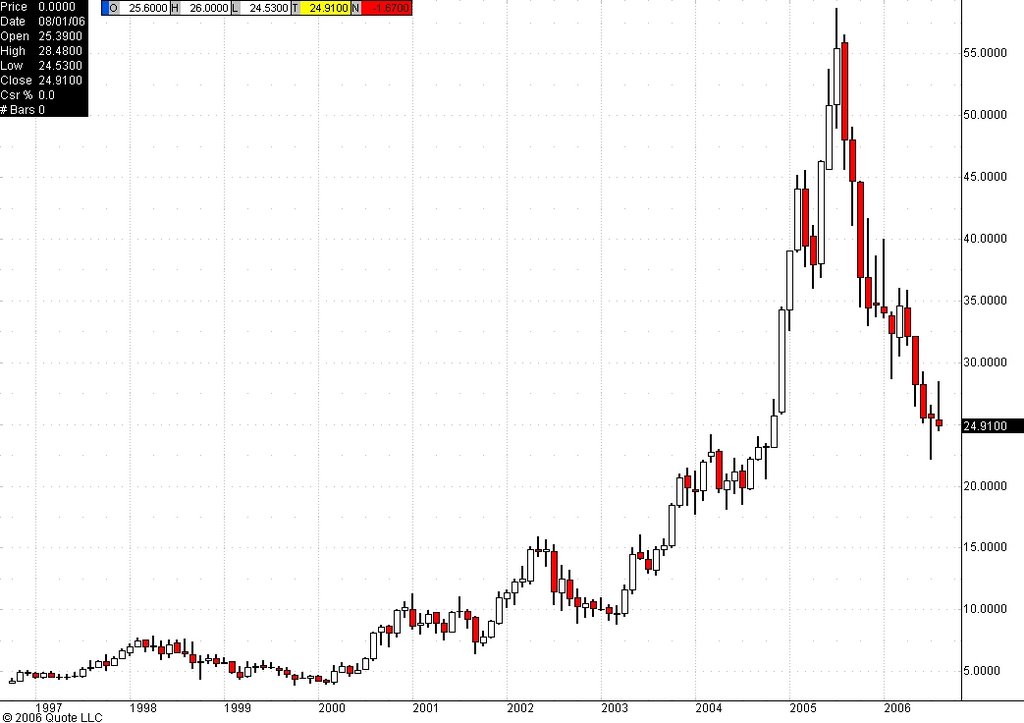
Here are monthly charts of TOL ( Toll Brothers: new home builders) and COMP (NASDAQ). Look at the parabolic rise of TOL from 2002 to 2005 and the identical pattern in the NASDAQ from 1997 to 2000. Anyone that still puts forth the theory that housing was not in a bubble and is not experiencing a severe correction is, to put it mildly, in denial. The TOL chart clearly shows more downside ahead for the housing market. The stock is trading at 24 today, it was at 10 in 2003. More pain ahead for that sector.
This entry was posted
on Wednesday, August 09, 2006 at 7:48 AM.
![]()
![]()