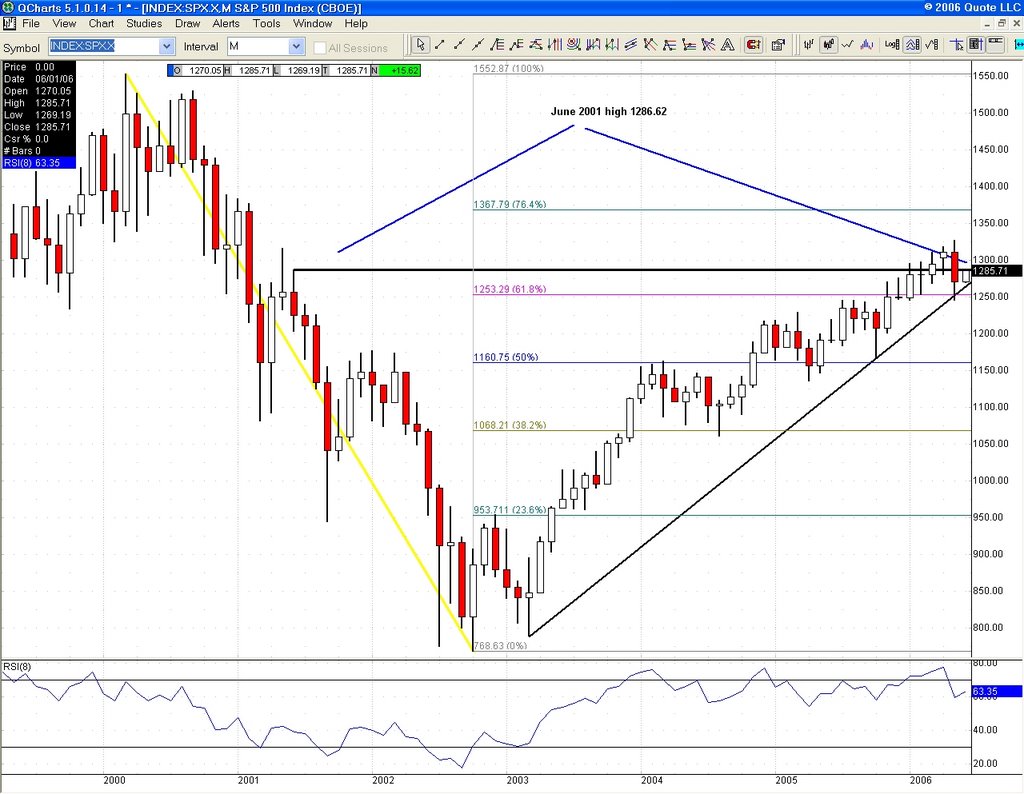
SPX (S&P 500) monthly chart. Once again, we come up to the June 2001 high of 1286.62. This time around, it could prove to be a little more difficult on a closing basis then back in March of this year. Note the bounce off 2003 bull market trendline support.
This entry was posted
on Thursday, June 01, 2006 at 8:59 PM.
![]()
![]()